|
Gene Information
Target gene [TPCN2] related to VISs 
Relationship between gene expression and immune infiltrating cell level
| Data ID |
Disease |
Sample number |
Sample type |
|
GSE114783 (GEO) |
Chronic HBV (CHB) infection |
36 |
Chronic hepatitis B patients (HBV+)(10),Hepatocellular carcinoma (HBV+)(10),Liver cirrhosis(HBV+)(10),Normal(3),HBV carriers (3) |
|
GSE114783 (GEO) |
Hepatocellular carcinoma |
36 |
Chronic hepatitis B patients (HBV+)(10),Hepatocellular carcinoma (HBV+)(10),Liver cirrhosis(HBV+)(10),Normal(3),HBV carriers (3) |
|
GSE114783 (GEO) |
Liver cirrhosis |
36 |
Chronic hepatitis B patients (HBV+)(10),Hepatocellular carcinoma (HBV+)(10),Liver cirrhosis(HBV+)(10),Normal(3),HBV carriers (3) |
|
LIHC (TCGA) |
Liver hepatocellular carcinoma |
424 |
Liver hepatocellular carcinoma HCV (HBV+)(86), Liver hepatocellular carcinoma HCV (HBV-)(19), Liver hepatocellular carcinoma (HBV+)(209), Liver hepatocellular carcinoma (HBV+)(60), Paracancerous HCV (HBV+)(4), Paracancerous (HBV-)(28), Paracancerous (HBV+)(18) |
> Dataset: GSE114783
|
|
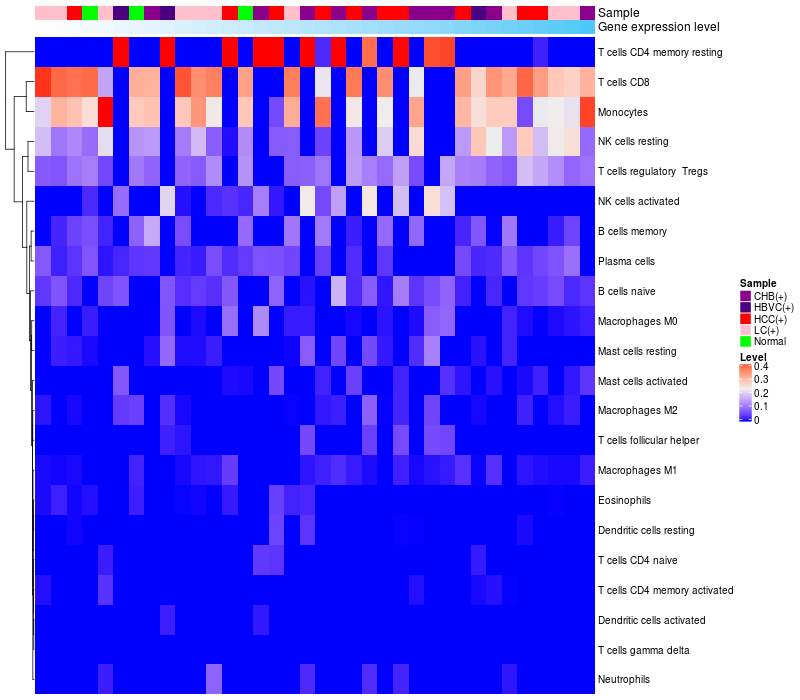
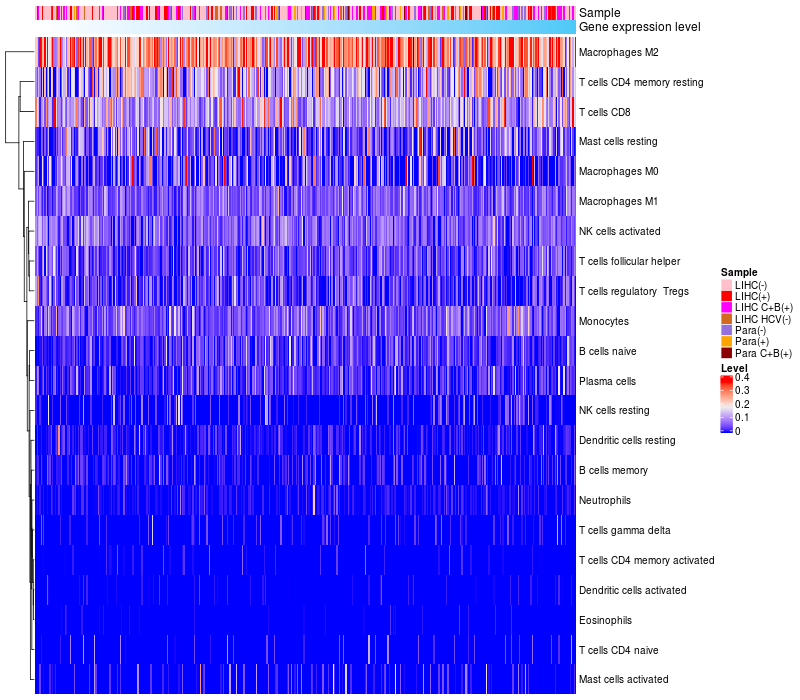
HeatMap of cell type fractions in all samples
|
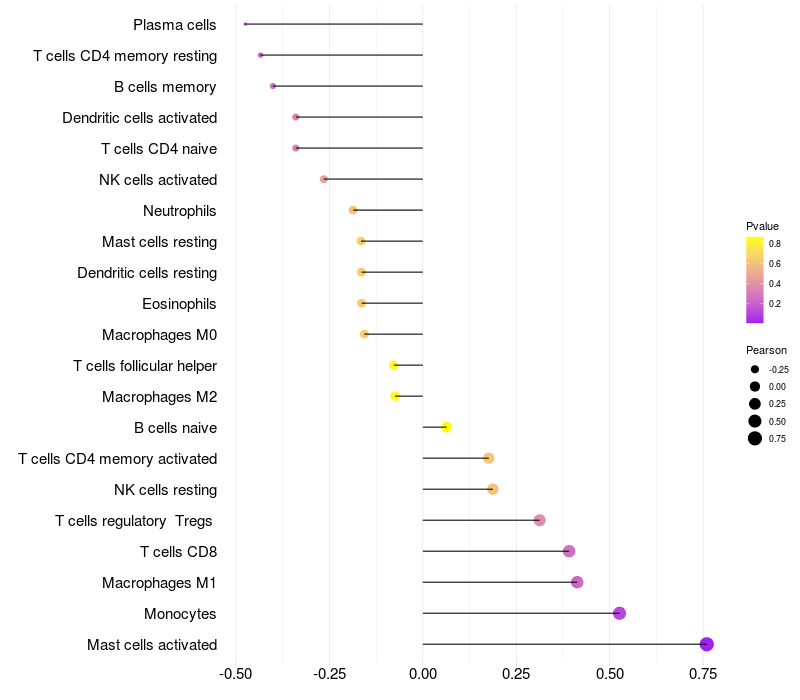
Lollipop of TPCN2 expression and immune infiltrating cell level correlation result in HBV+ Chronic HBV (CHB) infection samples
|
TPCN2 expression: Low -> High
|
|
|
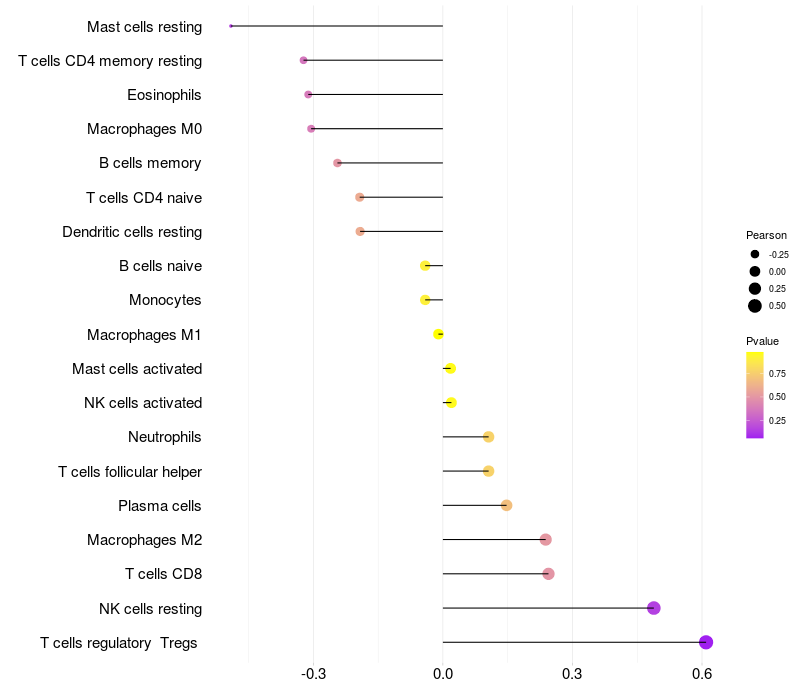
Lollipop of TPCN2 expression and immune infiltrating cell level correlation result in HBV+ Liver cirrhosis samples
|
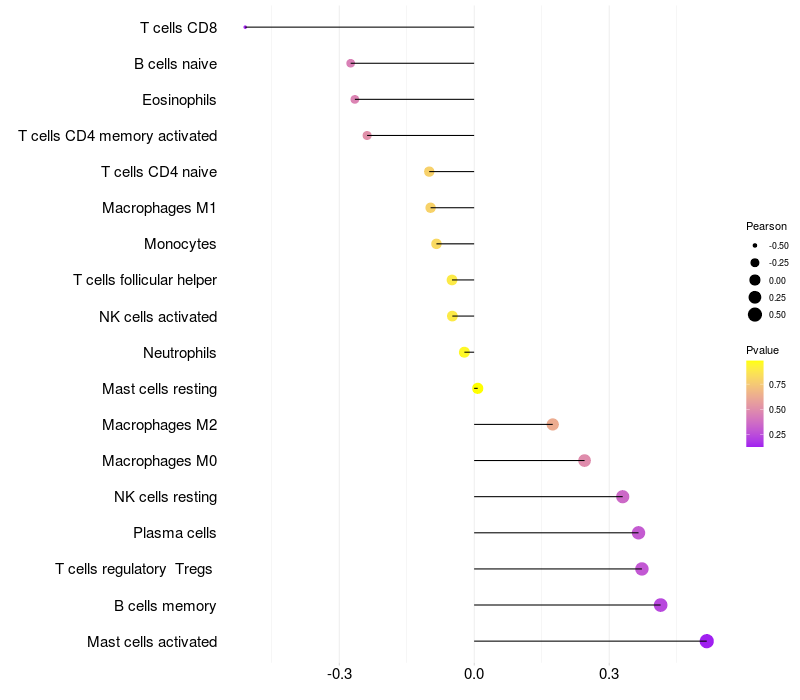
Lollipop of TPCN2 expression and immune infiltrating cell level correlation result in HBV+ Hepatocellular carcinoma samples
|
|
|
|
> Dataset: LIHC
|
|
HeatMap of cell type fractions in all samples
|
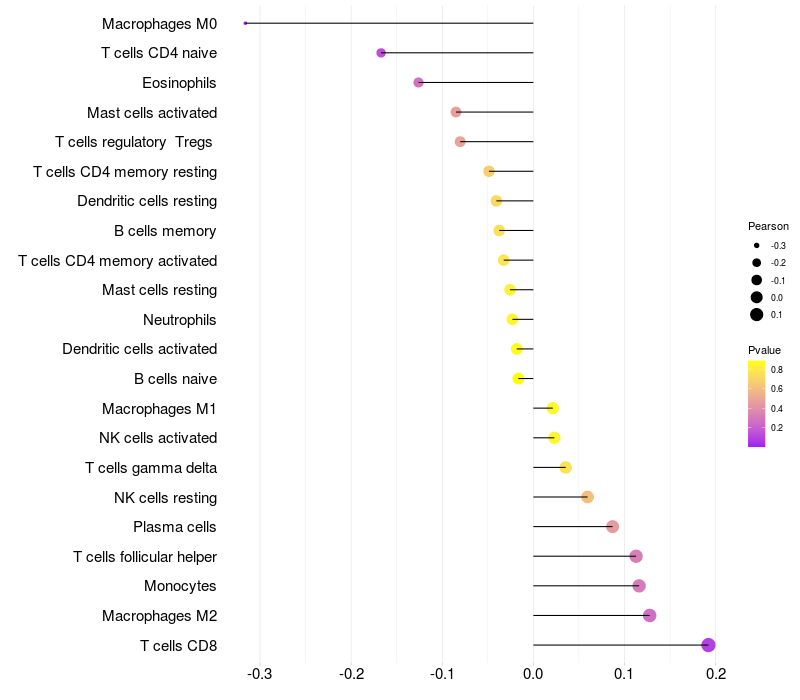
Lollipop of TPCN2 expression and immune infiltrating cell level correlation result in HBV+ samples
|
TPCN2 expression: Low -> High
|
|
|
|
|

 HBV Target gene Detail Information
