HIV Target gene Detail Information

> TBCD Gene Search Result


Gene Information
Gene Name TBCD
Gene ID 6904
Gene Full Name tubulin folding cofactor D
Gene Alias tfcD; PEBAT; SSD-1
Transcripts ENSG00000278759
Virus HIV
Gene Type protein coding
HPA Location Info
Membrane Info Predicted membrane proteins
HPA Protein Class Info Disease related genes, Predicted intracellular proteins, Predicted membrane proteins
Uniport_ID Q9BTW9
HGNC ID HGNC:11581
VEGA ID OTTHUMG00000191319
OMIM ID 604649
String ID 9606.ENSP00000347719
PharmGKB ID PA36345
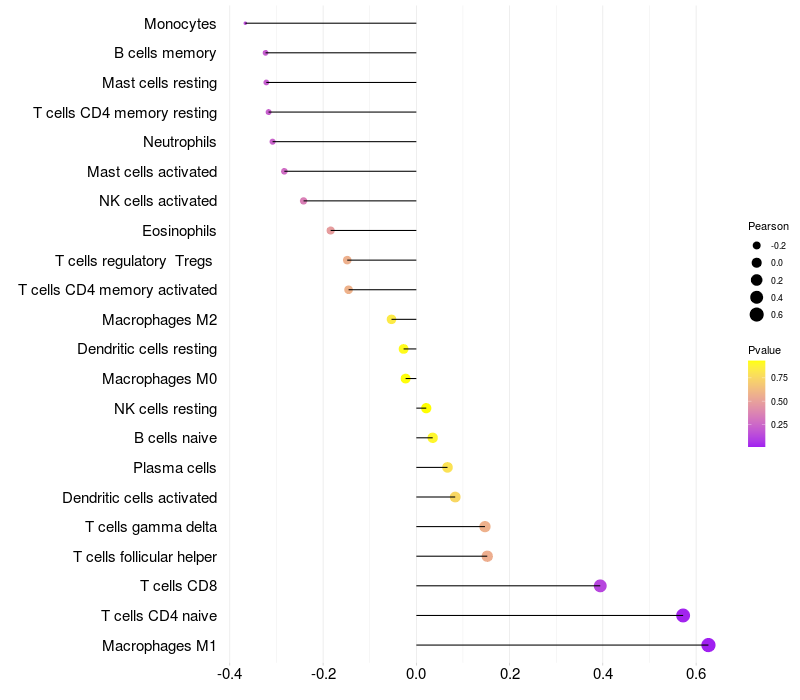
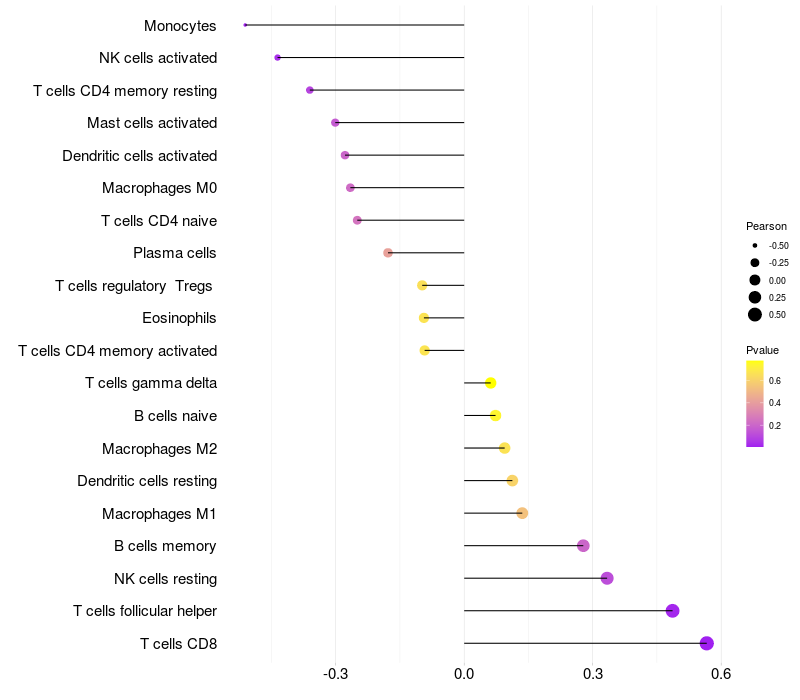
Target gene [TBCD] related to VISs
DVID Chromosome HM TFBS CA Sum of Overlapped Records Detail
4001787 chr17 112 16 4 132 View
4002153 chr17 105 4 109 View
4002164 chr17 96 6 2 104 View
4003654 chr17 21 1 35 57 View
4005826 chr17 29 29 View
4006021 chr17 23 4 27 View
4006022 chr17 23 4 27 View
4006023 chr17 23 4 27 View
4006024 chr17 23 4 27 View
4006025 chr17 23 4 27 View
4006026 chr17 23 4 27 View
4006028 chr17 23 4 27 View
4009241 chr17 7 5 12 View
4010237 chr17 4 5 9 View
4011317 chr17 2 4 1 7 View
4013238 chr17 2 2 4 View

Relationship between gene expression and immune infiltrating cell level
Data ID Disease Sample number Sample type
GSE17372 (GEO) AIDS-associated lymphoma 17 AIDS-Related Lymphomas (HIV+)(17)
GSE50834 (GEO) HIV-infected disease 44 HIV infected (23), HIV/TB co-infected (21)

> Dataset: GSE17372

HeatMap of cell type fractions in all samples Lollipop of TBCD expression and immune infiltrating cell level correlation result in HIV+ samples
TBCD expression: Low -> High

> Dataset: GSE50834

HeatMap of cell type fractions in all samples Lollipop of TBCD expression and immune infiltrating cell level correlation result in HIV+ samples
TBCD expression: Low -> High

Contents
Description

Gene Information Note

  • Integration Table: if previous studies reported that target gene was altered by virus integration events, the overlap between VISs in this literature and Cistrome factors was listed in the "Target gene [gene] related to VIS" section

Immune Analysis Plot Note

  • Left: Heatmap of target gene expression and the level of various types of immune cells (cell type fractions) in all samples based on CIBERSORT method.
  • Right: Correlation of target gene expression and the level of various types of immune cells in virus positive samples (Pearson Correlation Coefficient).