|
Gene Information
|
Gene Name
|
SLC5A1 |
|
Gene ID
|
6523
|
|
Gene Full Name
|
solute carrier family 5 member 1 |
|
Gene Alias
|
NAGT; SGLT1; D22S675 |
|
Transcripts
|
ENSG00000100170
|
|
Virus
|
HTLV1 |
|
Gene Type
|
protein coding |
|
HPA Location Info
|
Golgi apparatus;Nucleoplasm;Cytosol;Nuclear membrane; 
|
|
Membrane Info
|
Predicted membrane proteins |
|
HPA Protein Class Info
|
Disease related genes, Plasma proteins, Potential drug targets, Predicted membrane proteins, Transporters |
|
Uniport_ID
|
P13866
|
|
HGNC ID
|
HGNC:11036
|
|
VEGA ID
|
OTTHUMG00000030768
|
|
OMIM ID
|
182380 |
|
String ID
|
9606.ENSP00000266088
|
|
Drugbank ID
|
BE0004754
|
|
PharmGKB ID
|
PA308
|
Target gene [SLC5A1] related to VISs 
| DVID |
Chromosome |
HM |
TFBS |
CA |
Sum of Overlapped Records |
Detail |
| 6012811 |
chr22 |
2 |
19 |
|
21 |
View |
| 6017867 |
chr22 |
10 |
|
|
10 |
View |
Relationship between gene expression and immune infiltrating cell level
| Data ID |
Disease |
Sample number |
Sample type |
|
GSE55851 (GEO) |
Adult T-cell leukemia |
21 |
Normal (3), Asymptomatic carriers (HTLV1+)(6), Adult T-cell Leukemia-lymphoma (HTLV1+)(12) |
|
GSE29312 (GEO) |
HTLV-1 associated myelopathy |
39 |
Normal (9), Asymptomatic carriers (HTLV1+)(20), HTLV-1-associated myelopathy (HTLV1+)(10) |
|
GSE29332 (GEO) |
HTLV-1 associated myelopathy |
35 |
Normal (8), Asymptomatic carriers (HTLV1+)(17), HTLV-1-associated myelopathy (HTLV1+)(10) |
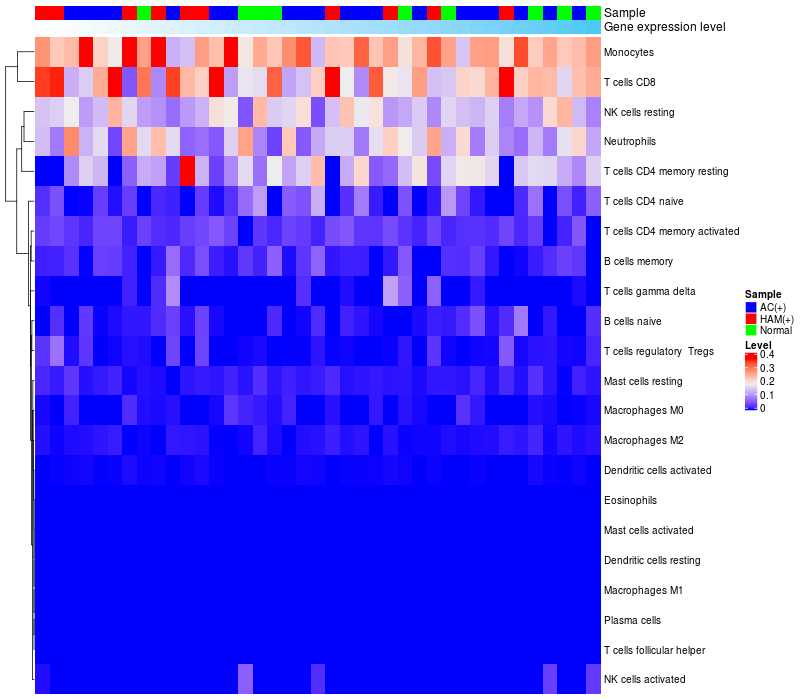
> Dataset: GSE55851
|
|
HeatMap of cell type fractions in all samples
|
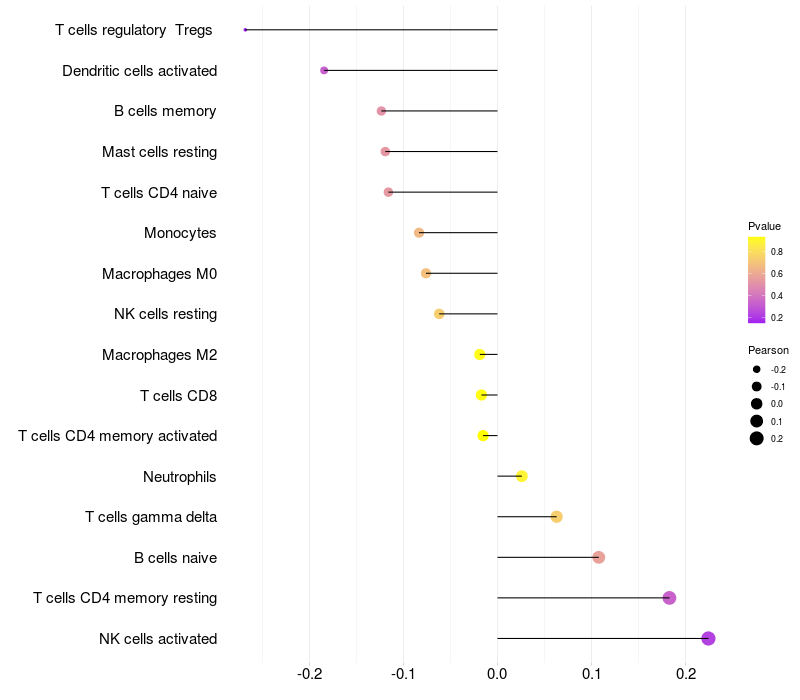
Lollipop of SLC5A1 expression and immune infiltrating cell level correlation result in HTLV1+ samples
|
SLC5A1 expression: Low -> High

|

|
|
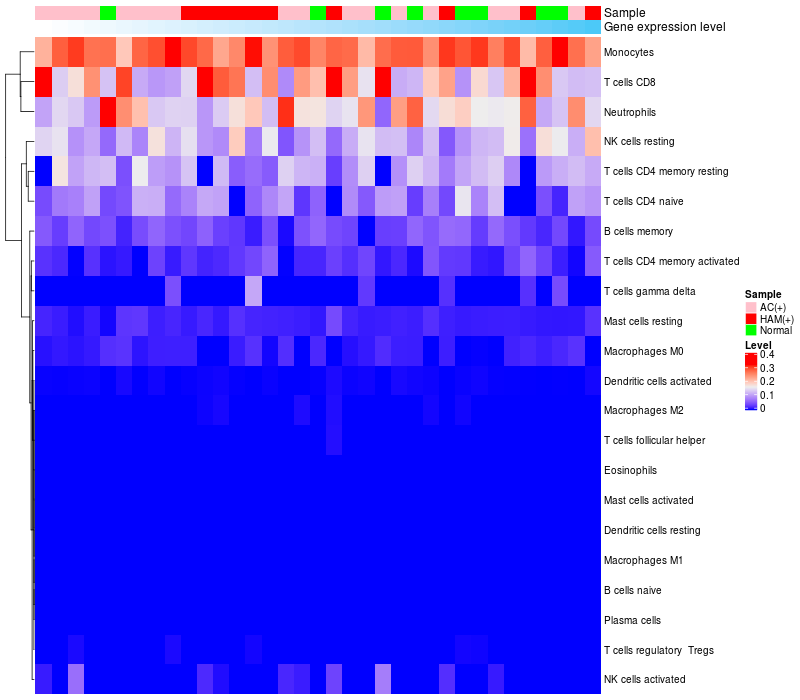
> Dataset: GSE29312
|
|
HeatMap of cell type fractions in all samples
|
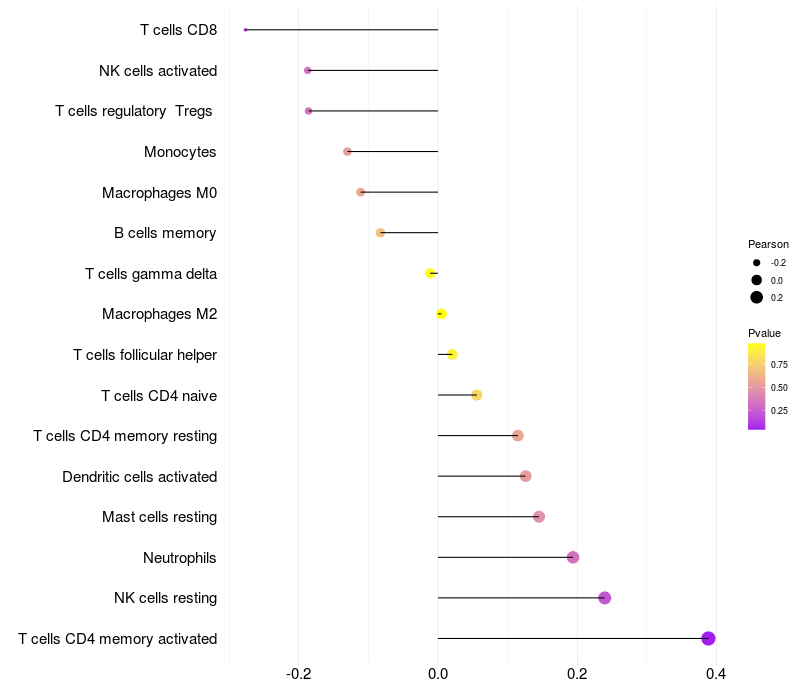
Lollipop of SLC5A1 expression and immune infiltrating cell level correlation result in HTLV1+ samples
|
SLC5A1 expression: Low -> High
|
|
|
> Dataset: GSE29332
|
|
HeatMap of cell type fractions in all samples
|
Lollipop of SLC5A1 expression and immune infiltrating cell level correlation result in HTLV1+ samples
|
SLC5A1 expression: Low -> High
|
|
|
|
|

 HTLV1 Target gene Detail Information