|
Gene Information
|
Gene Name
|
SFXN4 |
|
Gene ID
|
119559
|
|
Gene Full Name
|
sideroflexin 4 |
|
Gene Alias
|
BCRM1; COXPD18; SLC56A4 |
|
Transcripts
|
ENSG00000183605
|
|
Virus
|
HTLV1 |
|
Gene Type
|
protein coding |
|
HPA Location Info
|

|
|
Membrane Info
|
Predicted membrane proteins |
|
HPA Protein Class Info
|
Disease related genes, Potential drug targets, Predicted intracellular proteins, Predicted membrane proteins, Transporters |
|
Uniport_ID
|
Q6P4A7
|
|
HGNC ID
|
HGNC:16088
|
|
VEGA ID
|
OTTHUMG00000019147
|
|
OMIM ID
|
615564 |
|
String ID
|
9606.ENSP00000347924
|
|
PharmGKB ID
|
PA38093
|
Target gene [SFXN4] related to VISs 
| DVID |
Chromosome |
HM |
TFBS |
CA |
Sum of Overlapped Records |
Detail |
| 6005583 |
chr10 |
70 |
9 |
5 |
84 |
View |
Relationship between gene expression and immune infiltrating cell level
| Data ID |
Disease |
Sample number |
Sample type |
|
GSE55851 (GEO) |
Adult T-cell leukemia |
21 |
Normal (3), Asymptomatic carriers (HTLV1+)(6), Adult T-cell Leukemia-lymphoma (HTLV1+)(12) |
|
GSE29312 (GEO) |
HTLV-1 associated myelopathy |
39 |
Normal (9), Asymptomatic carriers (HTLV1+)(20), HTLV-1-associated myelopathy (HTLV1+)(10) |
|
GSE29332 (GEO) |
HTLV-1 associated myelopathy |
35 |
Normal (8), Asymptomatic carriers (HTLV1+)(17), HTLV-1-associated myelopathy (HTLV1+)(10) |
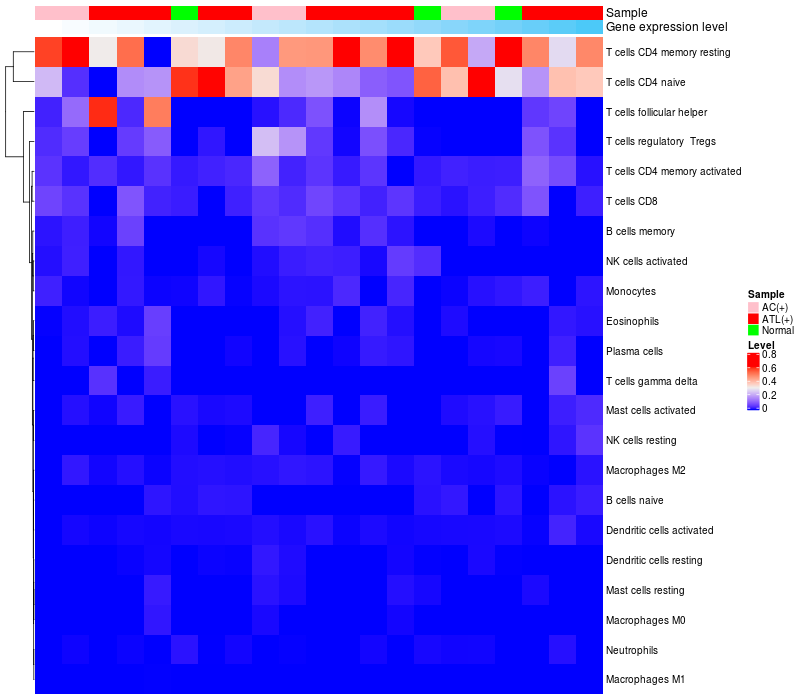
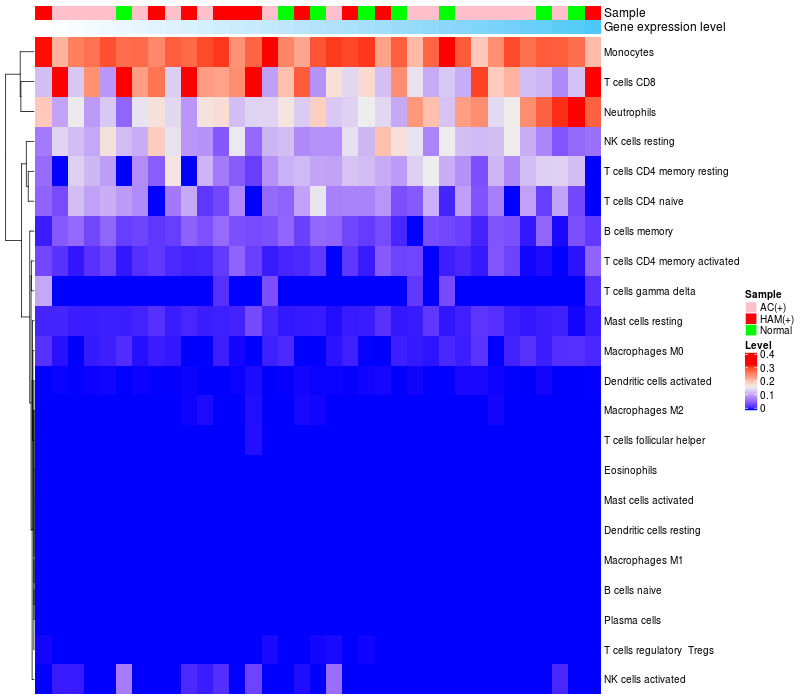
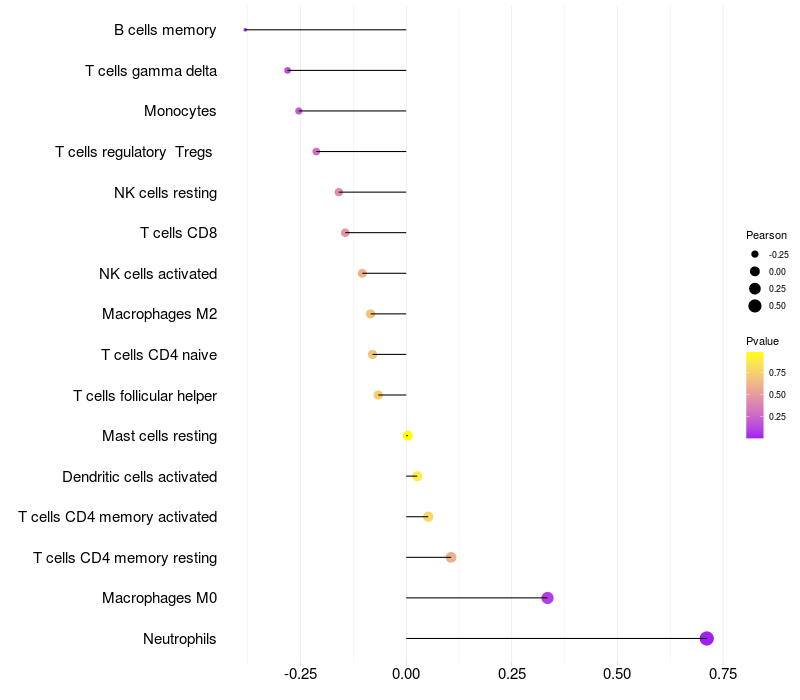
> Dataset: GSE55851
|
|
HeatMap of cell type fractions in all samples
|
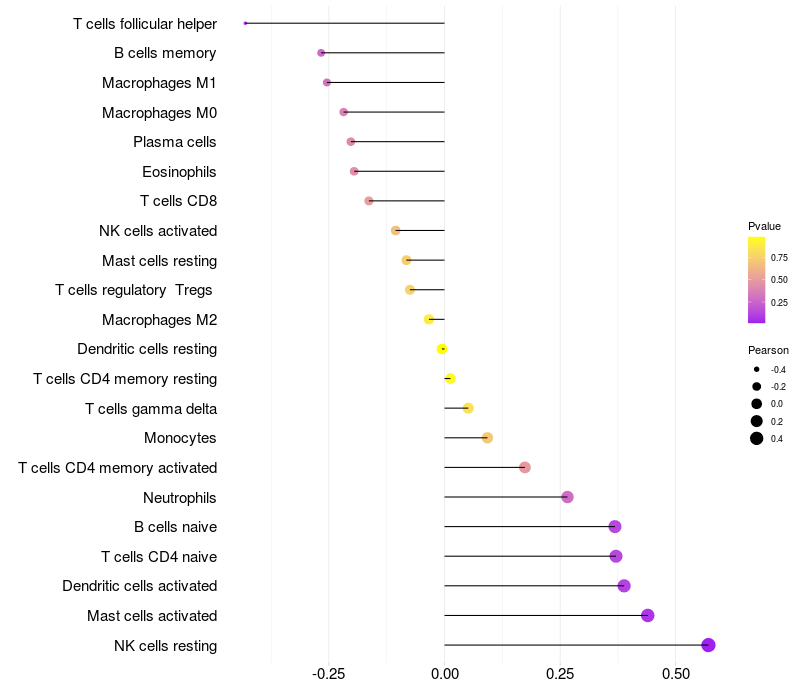
Lollipop of SFXN4 expression and immune infiltrating cell level correlation result in HTLV1+ samples
|
SFXN4 expression: Low -> High
|
|
|
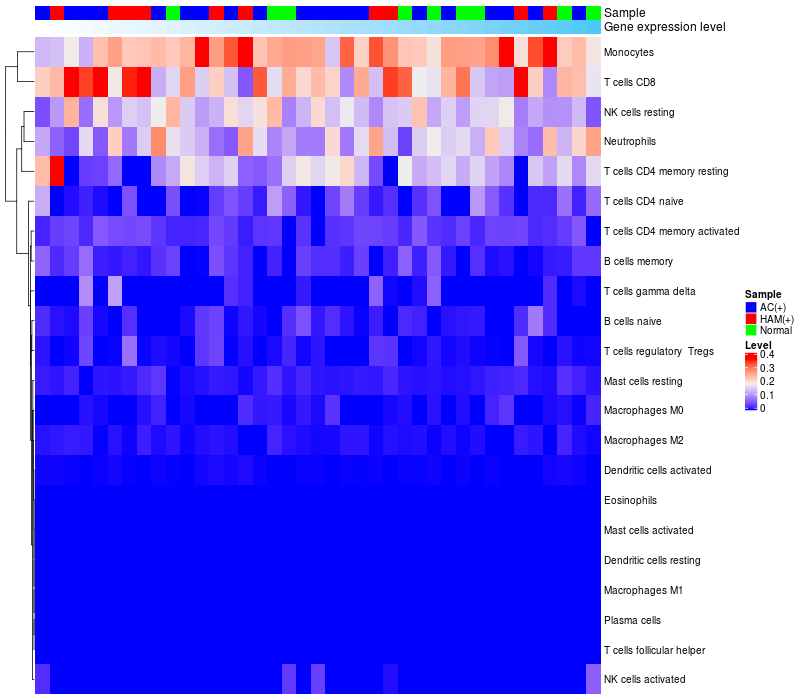
> Dataset: GSE29312
|
|
HeatMap of cell type fractions in all samples
|
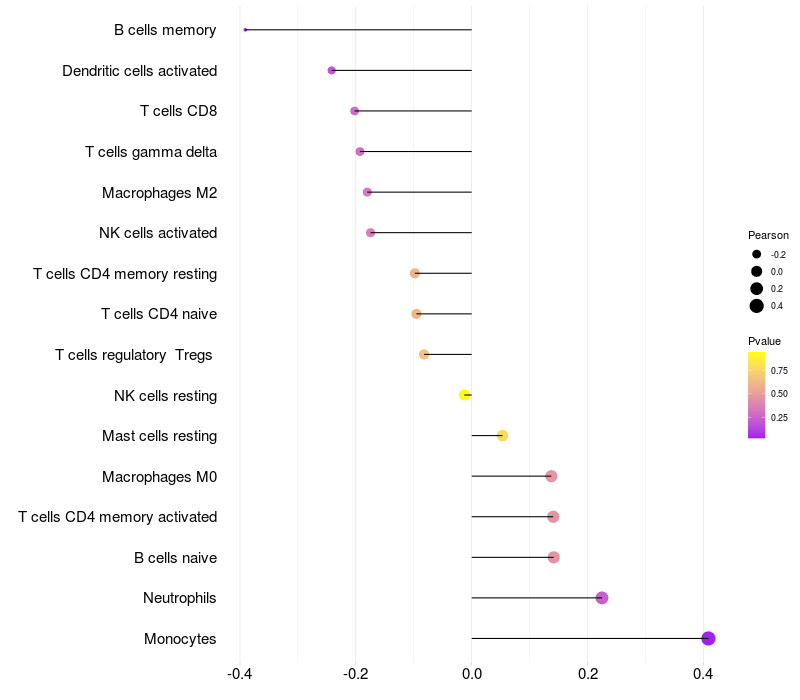
Lollipop of SFXN4 expression and immune infiltrating cell level correlation result in HTLV1+ samples
|
SFXN4 expression: Low -> High
|
|
|
> Dataset: GSE29332
|
|
HeatMap of cell type fractions in all samples
|
Lollipop of SFXN4 expression and immune infiltrating cell level correlation result in HTLV1+ samples
|
SFXN4 expression: Low -> High
|
|
|
|
|

 HTLV1 Target gene Detail Information