|
Gene Information
|
Gene Name
|
SCN8A |
|
Gene ID
|
6334
|
|
Gene Full Name
|
sodium voltage-gated channel alpha subunit 8 |
|
Gene Alias
|
MED; PN4; CIAT; BFIS5; NaCh6; CERIII; EIEE13; Nav1.6 |
|
Transcripts
|
ENSG00000196876
|
|
Virus
|
HTLV1 |
|
Gene Type
|
protein coding |
|
HPA Location Info
|
Plasma membrane;Cell Junctions;Vesicles; 
|
|
Membrane Info
|
Predicted membrane proteins |
|
HPA Protein Class Info
|
Disease related genes, FDA approved drug targets, Plasma proteins, Predicted intracellular proteins, Predicted membrane proteins, Transporters, Voltage-gated ion channels |
|
Uniport_ID
|
Q9UQD0
|
|
HGNC ID
|
HGNC:10596
|
|
VEGA ID
|
OTTHUMG00000169490
|
|
OMIM ID
|
600702 |
|
String ID
|
9606.ENSP00000346534
|
|
Drugbank ID
|
BE0002084;
BE0009738;
BE0004901
|
|
PharmGKB ID
|
PA35009
|
Target gene [SCN8A] related to VISs 
| DVID |
Chromosome |
HM |
TFBS |
CA |
Sum of Overlapped Records |
Detail |
| 6015354 |
chr12 |
1 |
13 |
|
14 |
View |
| 6025329 |
chr12 |
1 |
2 |
|
3 |
View |
Relationship between gene expression and immune infiltrating cell level
| Data ID |
Disease |
Sample number |
Sample type |
|
GSE55851 (GEO) |
Adult T-cell leukemia |
21 |
Normal (3), Asymptomatic carriers (HTLV1+)(6), Adult T-cell Leukemia-lymphoma (HTLV1+)(12) |
|
GSE29312 (GEO) |
HTLV-1 associated myelopathy |
39 |
Normal (9), Asymptomatic carriers (HTLV1+)(20), HTLV-1-associated myelopathy (HTLV1+)(10) |
|
GSE29332 (GEO) |
HTLV-1 associated myelopathy |
35 |
Normal (8), Asymptomatic carriers (HTLV1+)(17), HTLV-1-associated myelopathy (HTLV1+)(10) |
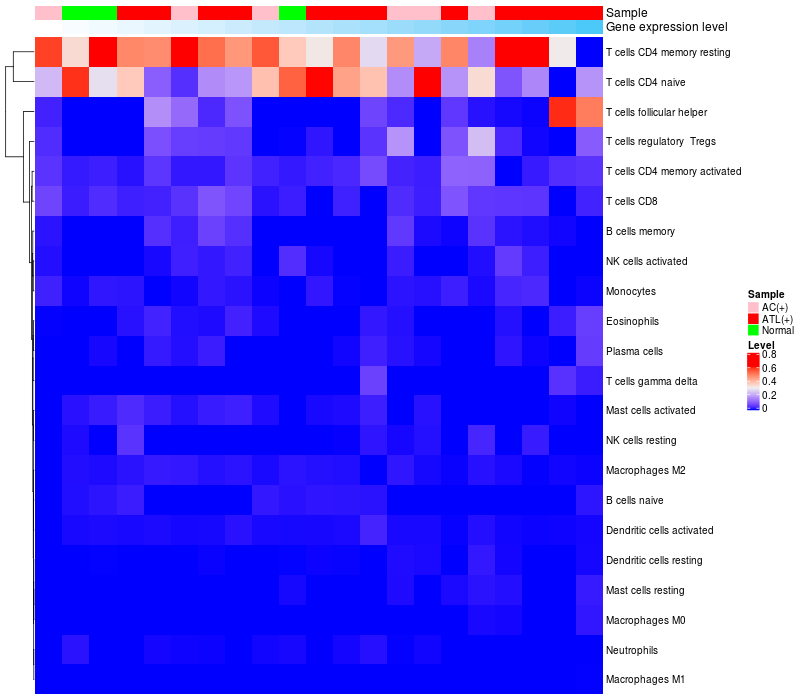
> Dataset: GSE55851
|
|
HeatMap of cell type fractions in all samples
|
Lollipop of SCN8A expression and immune infiltrating cell level correlation result in HTLV1+ samples
|
SCN8A expression: Low -> High
|

|
|
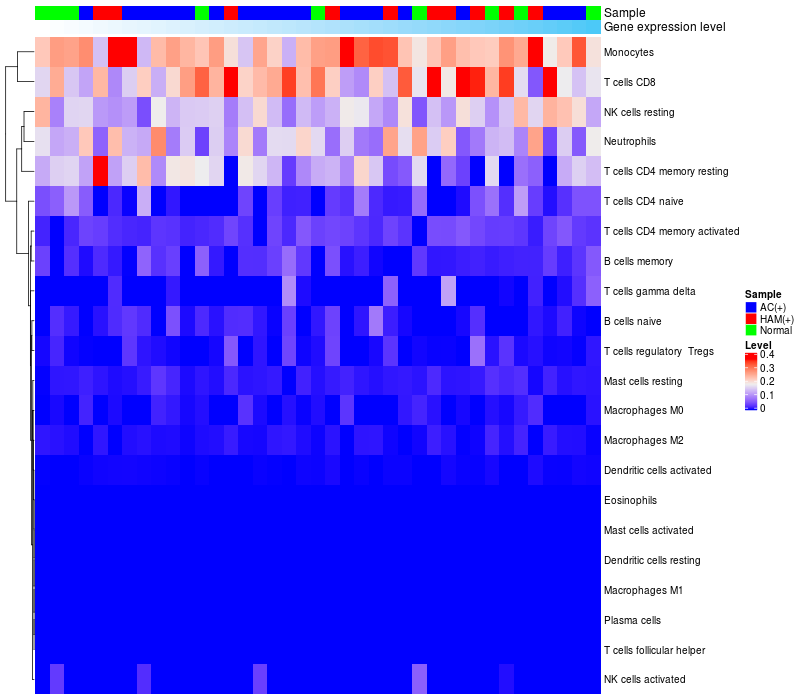
> Dataset: GSE29312
|
|
HeatMap of cell type fractions in all samples
|
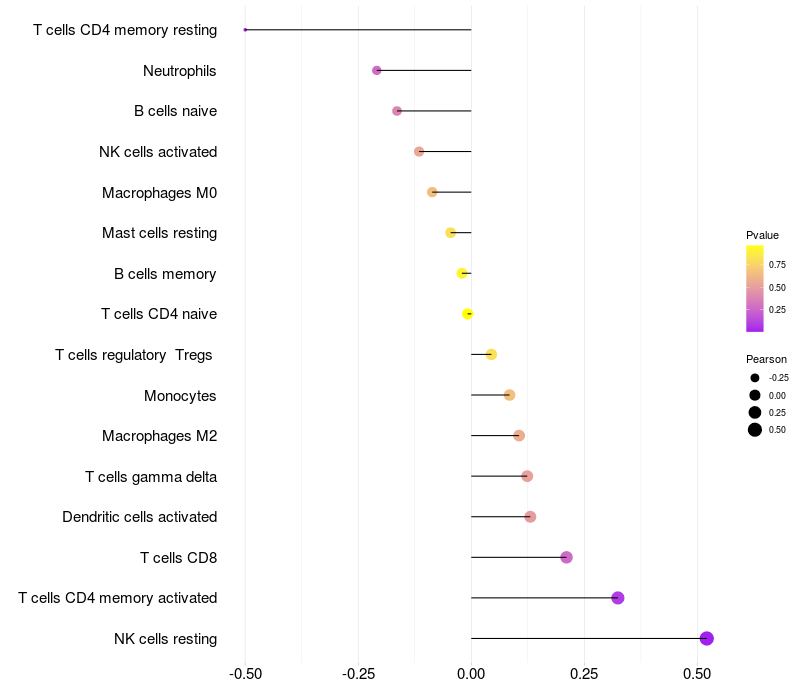
Lollipop of SCN8A expression and immune infiltrating cell level correlation result in HTLV1+ samples
|
SCN8A expression: Low -> High
|
|
|
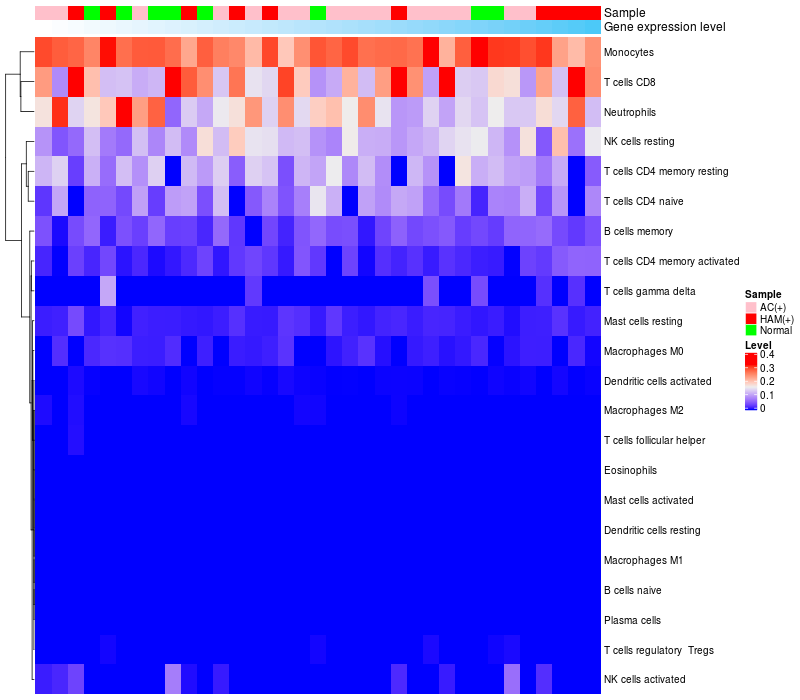
> Dataset: GSE29332
|
|
HeatMap of cell type fractions in all samples
|
Lollipop of SCN8A expression and immune infiltrating cell level correlation result in HTLV1+ samples
|
SCN8A expression: Low -> High
|

|
|
|
|

 HTLV1 Target gene Detail Information