|
Gene Information
|
Gene Name
|
PC |
|
Gene ID
|
5091
|
|
Gene Full Name
|
pyruvate carboxylase |
|
Gene Alias
|
PCB |
|
Transcripts
|
ENSG00000173599
|
|
Virus
|
HTLV1 |
|
Gene Type
|
protein coding |
|
HPA Location Info
|
Mitochondria; 
|
|
HPA Protein Class Info
|
Citric acid cycle related proteins, Disease related genes, Enzymes, Plasma proteins, Potential drug targets, Predicted intracellular proteins |
|
Uniport_ID
|
P11498
|
|
HGNC ID
|
HGNC:8636
|
|
VEGA ID
|
OTTHUMG00000167099
|
|
OMIM ID
|
608786 |
|
String ID
|
9606.ENSP00000377532
|
|
Drugbank ID
|
BE0000698
|
|
PharmGKB ID
|
PA32975
|
Target gene [PC] related to VISs 
Relationship between gene expression and immune infiltrating cell level
| Data ID |
Disease |
Sample number |
Sample type |
|
GSE55851 (GEO) |
Adult T-cell leukemia |
21 |
Normal (3), Asymptomatic carriers (HTLV1+)(6), Adult T-cell Leukemia-lymphoma (HTLV1+)(12) |
|
GSE29312 (GEO) |
HTLV-1 associated myelopathy |
39 |
Normal (9), Asymptomatic carriers (HTLV1+)(20), HTLV-1-associated myelopathy (HTLV1+)(10) |
|
GSE29332 (GEO) |
HTLV-1 associated myelopathy |
35 |
Normal (8), Asymptomatic carriers (HTLV1+)(17), HTLV-1-associated myelopathy (HTLV1+)(10) |
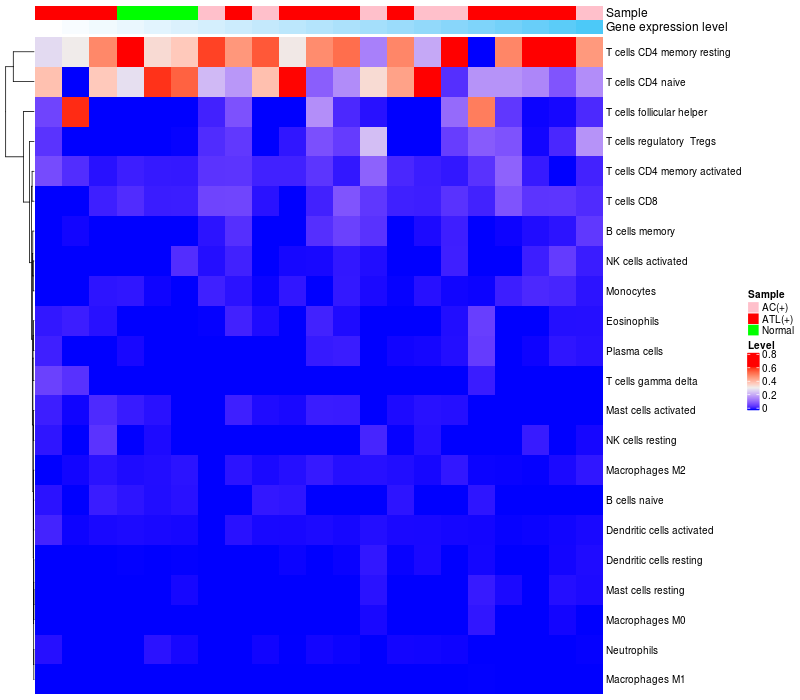
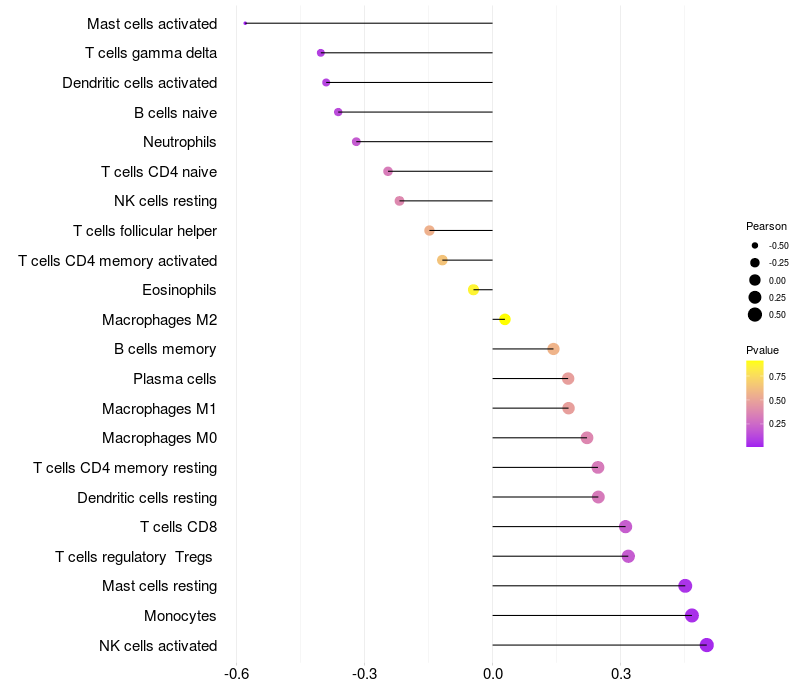
> Dataset: GSE55851
|
|
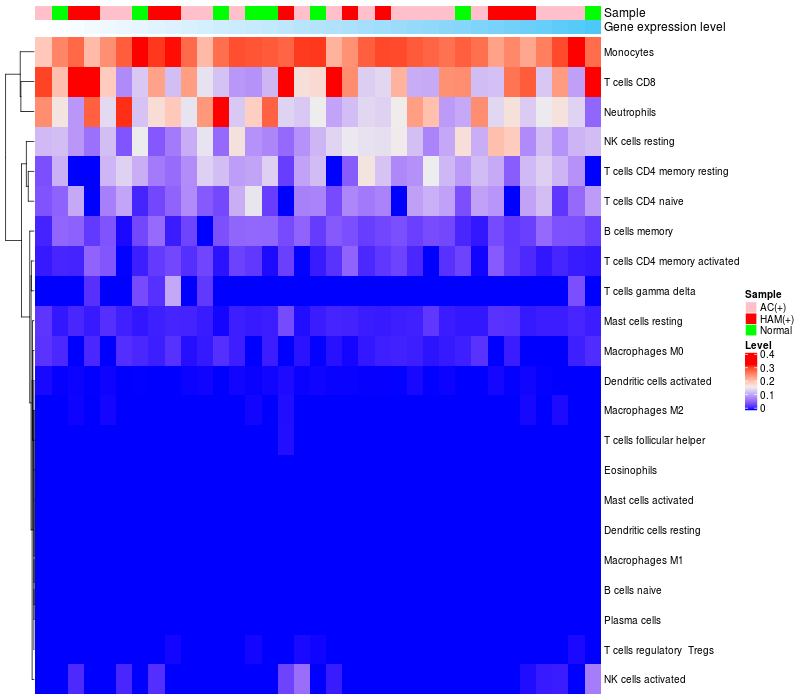
HeatMap of cell type fractions in all samples
|
Lollipop of PC expression and immune infiltrating cell level correlation result in HTLV1+ samples
|
PC expression: Low -> High
|
|
|
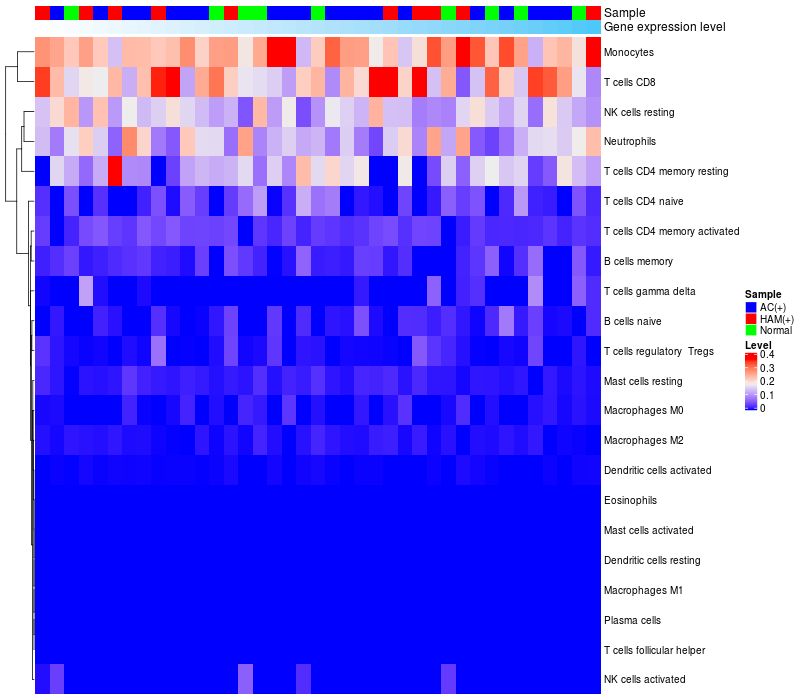
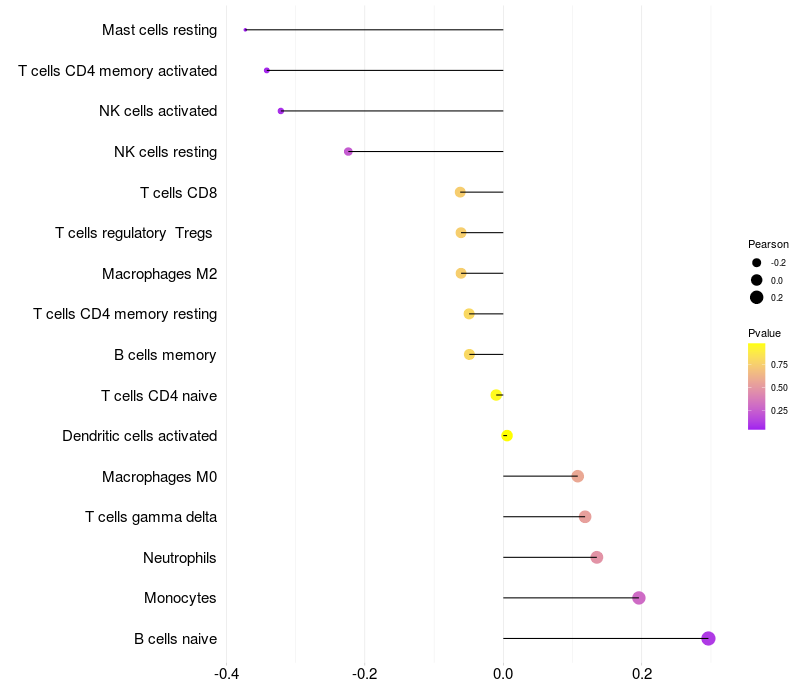
> Dataset: GSE29312
|
|
HeatMap of cell type fractions in all samples
|
Lollipop of PC expression and immune infiltrating cell level correlation result in HTLV1+ samples
|
PC expression: Low -> High
|
|
|
> Dataset: GSE29332
|
|
HeatMap of cell type fractions in all samples
|
Lollipop of PC expression and immune infiltrating cell level correlation result in HTLV1+ samples
|
PC expression: Low -> High
|

|
|
|
|

 HTLV1 Target gene Detail Information