|
Gene Information
|
Gene Name
|
MYT1 |
|
Gene ID
|
4661
|
|
Gene Full Name
|
myelin transcription factor 1 |
|
Gene Alias
|
MTF1; MYTI; NZF2; PLPB1; ZC2H2C1; ZC2HC4A; C20orf36 |
|
Transcripts
|
ENSG00000276876
|
|
Virus
|
HBV |
|
Gene Type
|
protein coding |
|
HPA Location Info
|
Nucleoplasm;Cytosol; 
|
|
HPA Protein Class Info
|
Plasma proteins, Predicted intracellular proteins, Transcription factors |
|
Uniport_ID
|
Q01538
|
|
HGNC ID
|
HGNC:7622
|
|
VEGA ID
|
OTTHUMG00000190291
|
|
OMIM ID
|
600379 |
|
String ID
|
9606.ENSP00000327465
|
|
PharmGKB ID
|
PA31426
|
Target gene [MYT1] related to VISs 
| DVID |
Chromosome |
HM |
TFBS |
CA |
Sum of Overlapped Records |
Detail |
| 1006274 |
chr20 |
34 |
6 |
|
40 |
View |
Relationship between gene expression and immune infiltrating cell level
| Data ID |
Disease |
Sample number |
Sample type |
|
GSE114783 (GEO) |
Chronic HBV (CHB) infection |
36 |
Chronic hepatitis B patients (HBV+)(10),Hepatocellular carcinoma (HBV+)(10),Liver cirrhosis(HBV+)(10),Normal(3),HBV carriers (3) |
|
GSE114783 (GEO) |
Hepatocellular carcinoma |
36 |
Chronic hepatitis B patients (HBV+)(10),Hepatocellular carcinoma (HBV+)(10),Liver cirrhosis(HBV+)(10),Normal(3),HBV carriers (3) |
|
GSE114783 (GEO) |
Liver cirrhosis |
36 |
Chronic hepatitis B patients (HBV+)(10),Hepatocellular carcinoma (HBV+)(10),Liver cirrhosis(HBV+)(10),Normal(3),HBV carriers (3) |
|
LIHC (TCGA) |
Liver hepatocellular carcinoma |
424 |
Liver hepatocellular carcinoma HCV (HBV+)(86), Liver hepatocellular carcinoma HCV (HBV-)(19), Liver hepatocellular carcinoma (HBV+)(209), Liver hepatocellular carcinoma (HBV+)(60), Paracancerous HCV (HBV+)(4), Paracancerous (HBV-)(28), Paracancerous (HBV+)(18) |
> Dataset: GSE114783
|
|
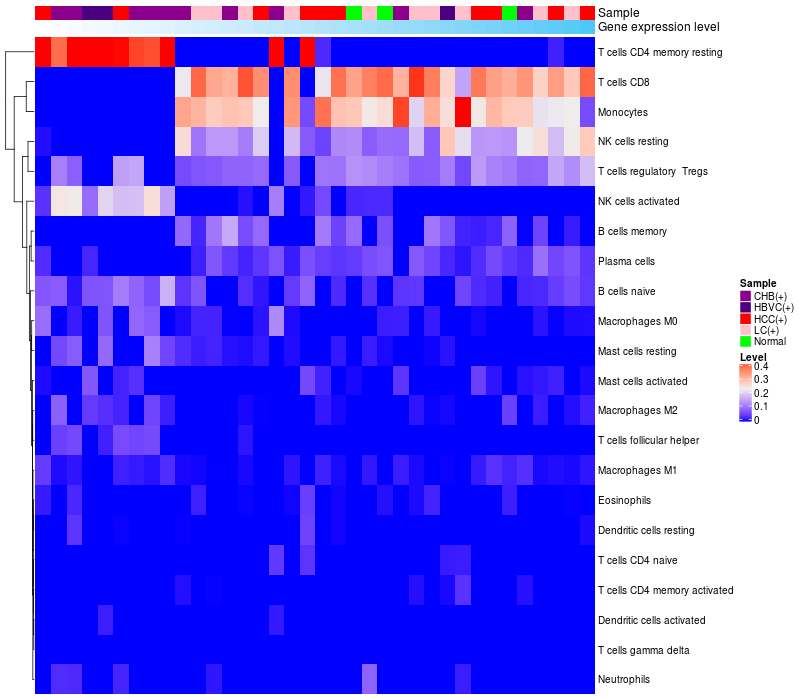
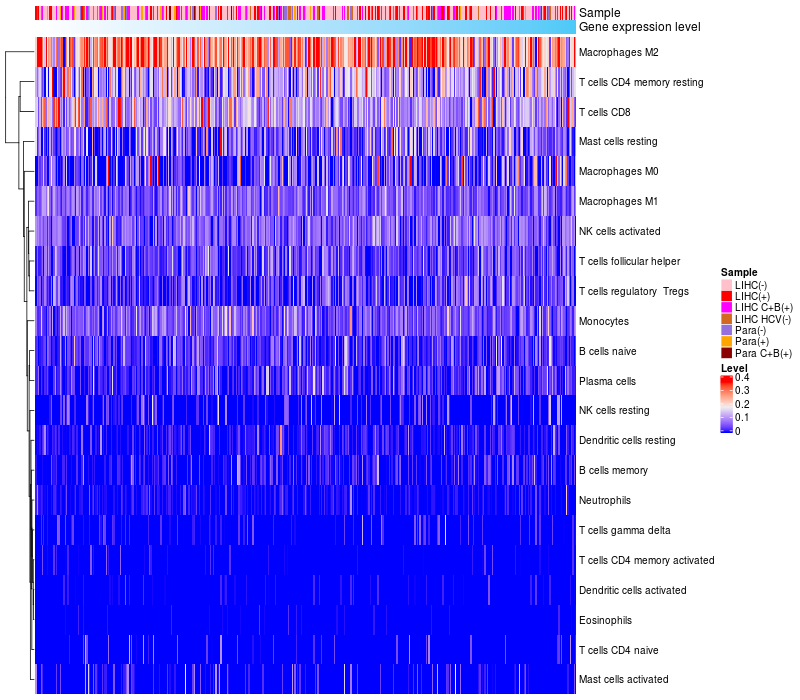
HeatMap of cell type fractions in all samples
|
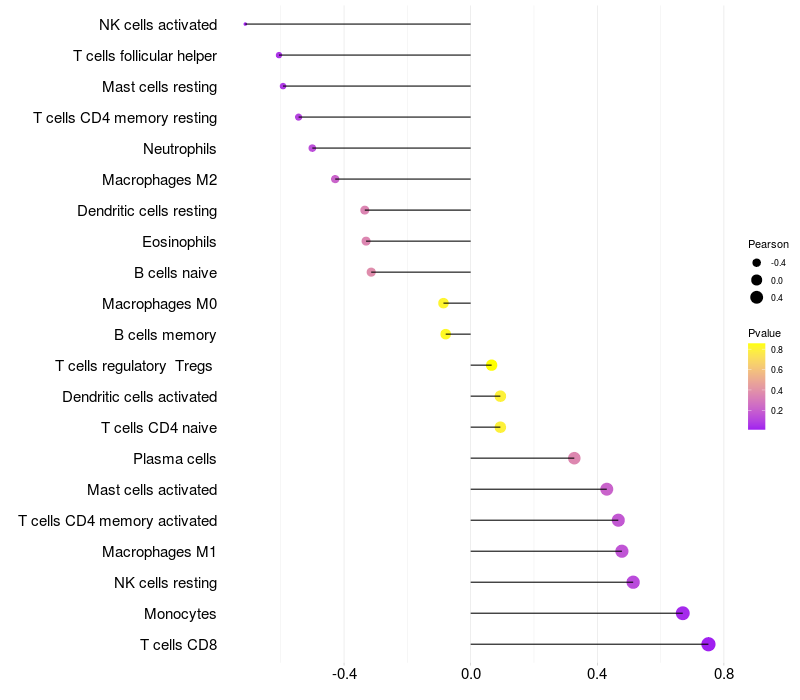
Lollipop of MYT1 expression and immune infiltrating cell level correlation result in HBV+ Chronic HBV (CHB) infection samples
|
MYT1 expression: Low -> High
|
|
|
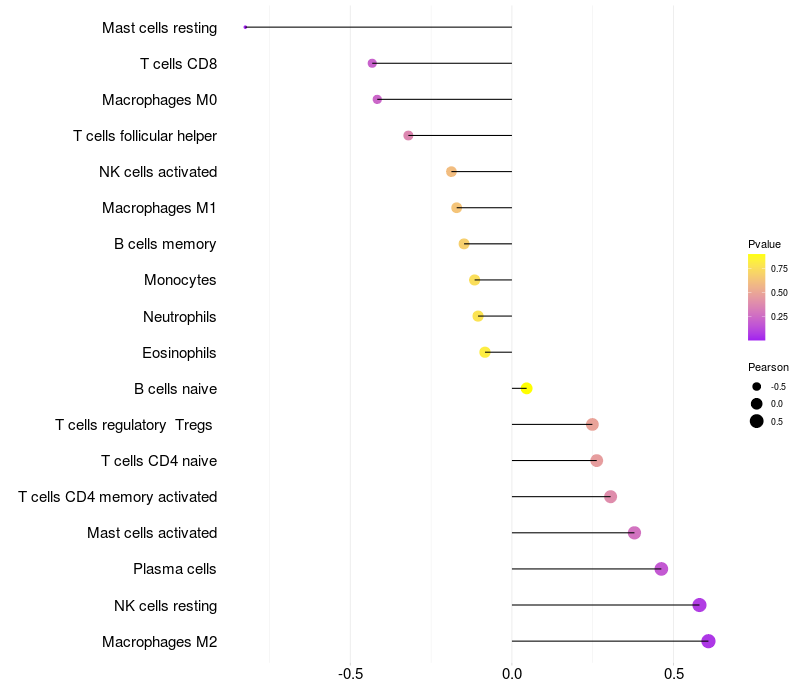
Lollipop of MYT1 expression and immune infiltrating cell level correlation result in HBV+ Liver cirrhosis samples
|
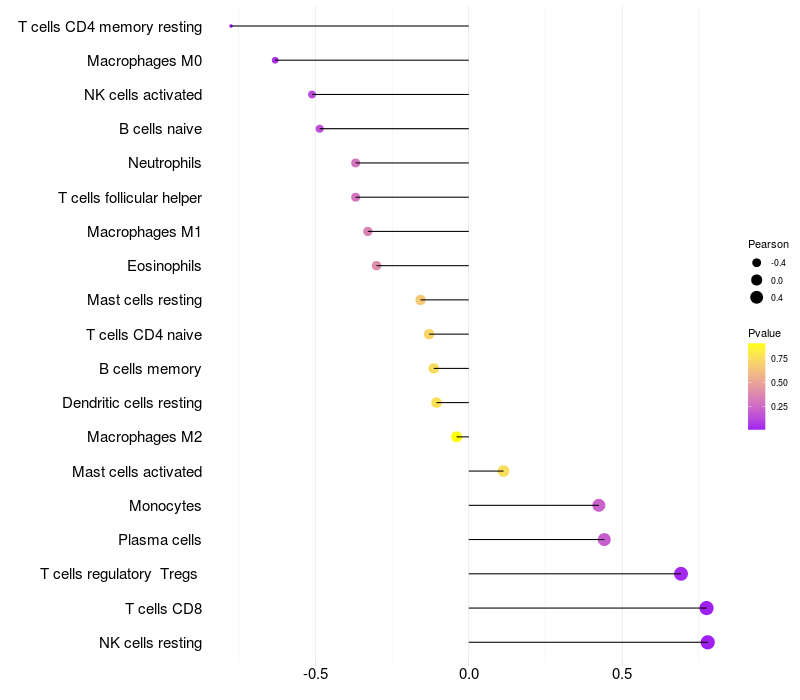
Lollipop of MYT1 expression and immune infiltrating cell level correlation result in HBV+ Hepatocellular carcinoma samples
|
|
|
|
> Dataset: LIHC
|
|
HeatMap of cell type fractions in all samples
|
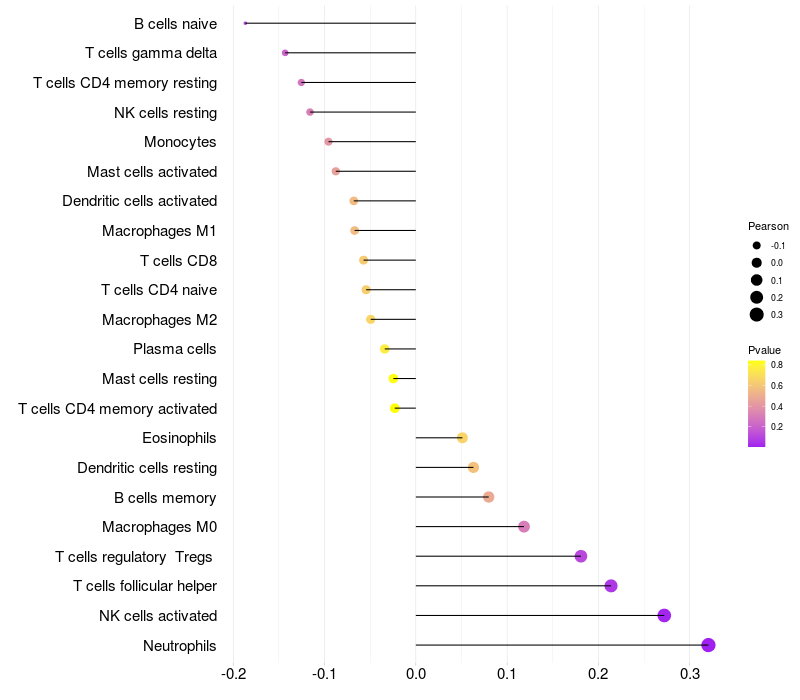
Lollipop of MYT1 expression and immune infiltrating cell level correlation result in HBV+ samples
|
MYT1 expression: Low -> High
|
|
|
|
|

 HBV Target gene Detail Information