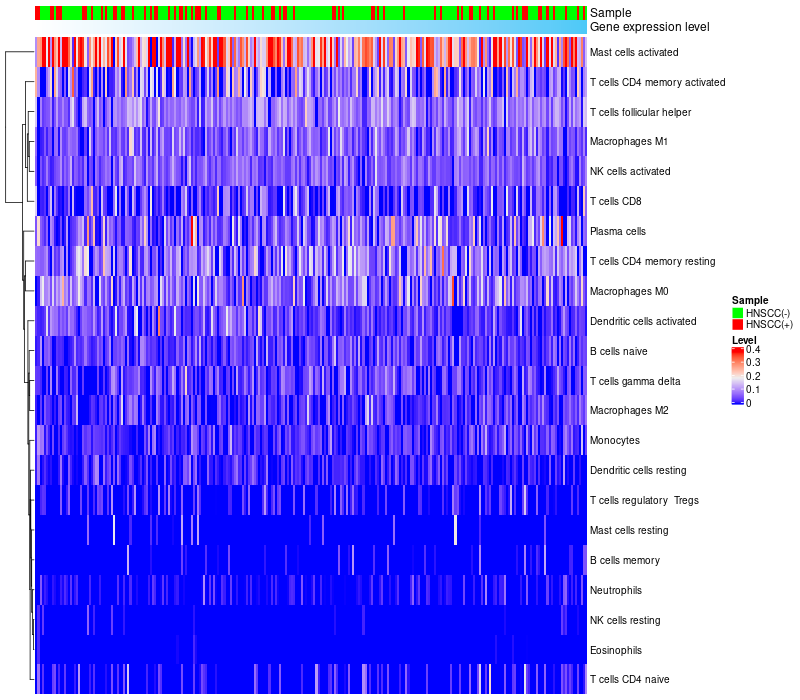
> Dataset: GSE65858
|
|
HeatMap of cell type fractions in all samples
|
Lollipop of MEOX1 expression and immune infiltrating cell level correlation result in HPV+ samples
|
MEOX1 expression: Low -> High
|

|
|
> Dataset: GSE51993
|
|
HeatMap of cell type fractions in all samples
|
Lollipop of MEOX1 expression and immune infiltrating cell level correlation result in HPV+ samples
|
MEOX1 expression: Low -> High

|

|
|
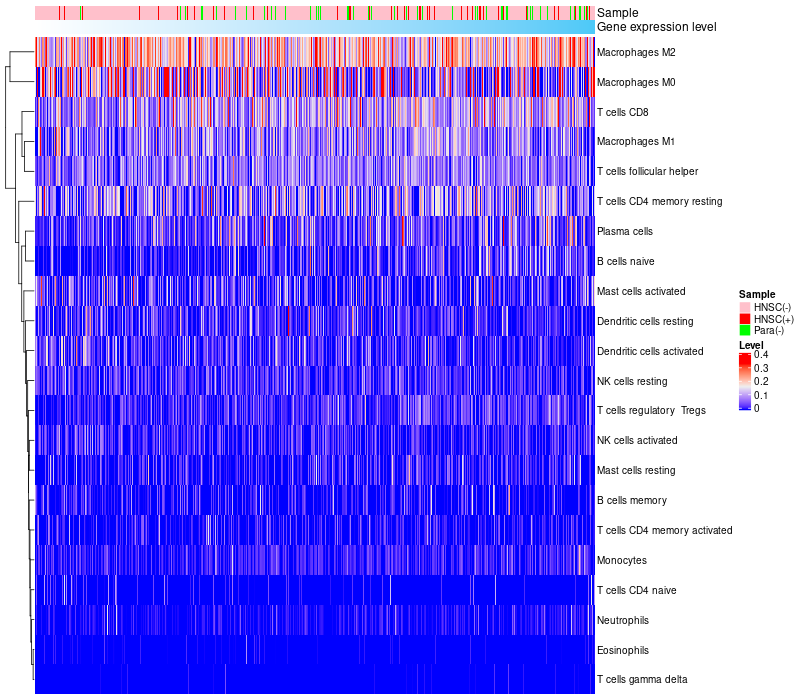
> Dataset: HNSC
|
|
HeatMap of cell type fractions in all samples
|
Lollipop of MEOX1 expression and immune infiltrating cell level correlation result in HPV+ samples
|
MEOX1 expression: Low -> High
|

|
|

 HPV Target gene Detail Information

