|
Gene Information
|
Gene Name
|
MAPK3 |
|
Gene ID
|
5595
|
|
Gene Full Name
|
mitogen-activated protein kinase 3 |
|
Gene Alias
|
ERK1; ERT2; ERK-1; PRKM3; P44ERK1; P44MAPK; HS44KDAP; HUMKER1A; p44-ERK1; p44-MAPK |
|
Transcripts
|
ENSG00000102882
|
|
Virus
|
HTLV1 |
|
Gene Type
|
protein coding |
|
HPA Location Info
|
Nucleoplasm; 
|
|
HPA Protein Class Info
|
Cancer-related genes, Enzymes, FDA approved drug targets, Predicted intracellular proteins, RAS pathway related proteins |
|
Uniport_ID
|
P27361
|
|
HGNC ID
|
HGNC:6877
|
|
VEGA ID
|
OTTHUMG00000132149
|
|
OMIM ID
|
601795 |
|
String ID
|
9606.ENSP00000263025
|
|
Drugbank ID
|
BE0001062;
BE0009853
|
|
PharmGKB ID
|
PA30622
|
Target gene [MAPK3] related to VISs 
| DVID |
Chromosome |
HM |
TFBS |
CA |
Sum of Overlapped Records |
Detail |
| 6006180 |
chr16 |
62 |
2 |
9 |
73 |
View |
Relationship between gene expression and immune infiltrating cell level
| Data ID |
Disease |
Sample number |
Sample type |
|
GSE55851 (GEO) |
Adult T-cell leukemia |
21 |
Normal (3), Asymptomatic carriers (HTLV1+)(6), Adult T-cell Leukemia-lymphoma (HTLV1+)(12) |
|
GSE29312 (GEO) |
HTLV-1 associated myelopathy |
39 |
Normal (9), Asymptomatic carriers (HTLV1+)(20), HTLV-1-associated myelopathy (HTLV1+)(10) |
|
GSE29332 (GEO) |
HTLV-1 associated myelopathy |
35 |
Normal (8), Asymptomatic carriers (HTLV1+)(17), HTLV-1-associated myelopathy (HTLV1+)(10) |
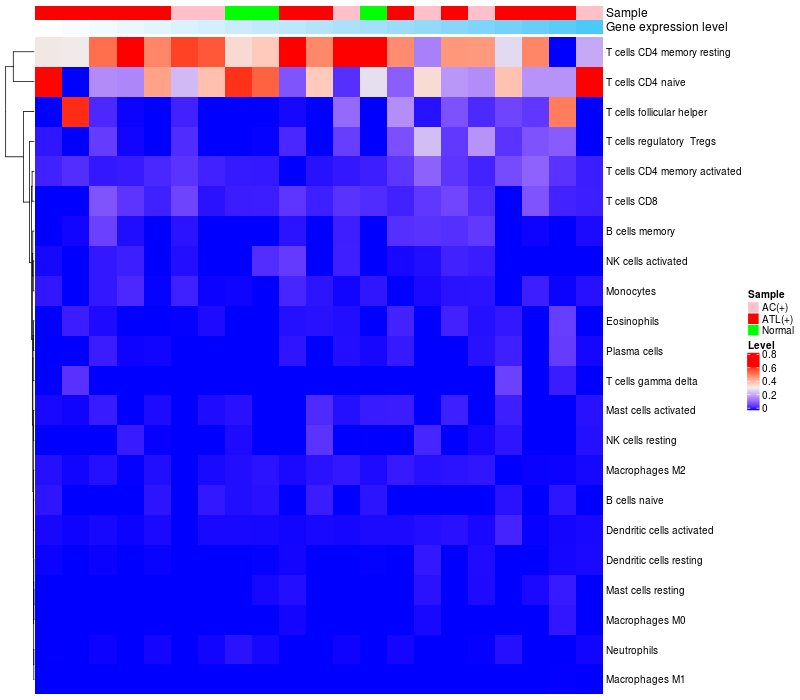
> Dataset: GSE55851
|
|
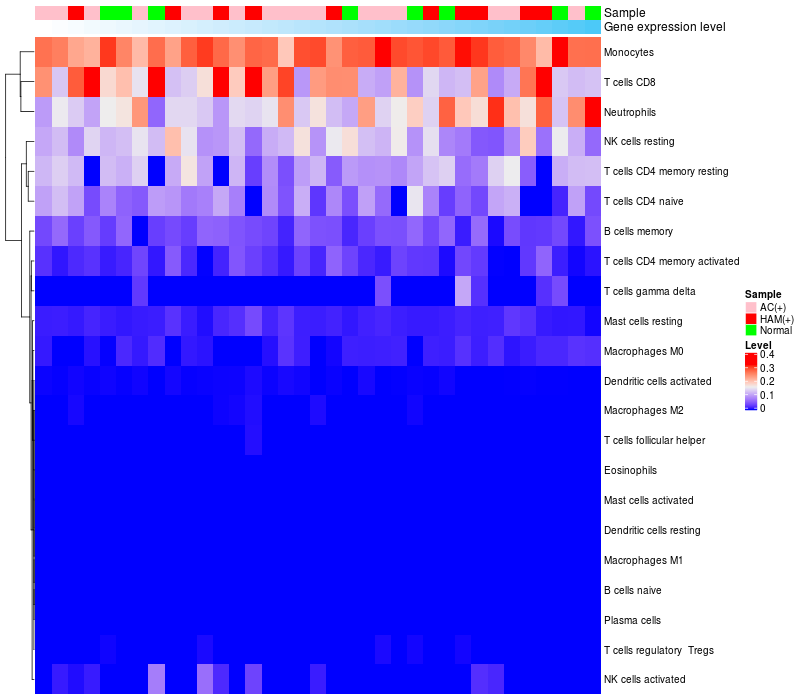
HeatMap of cell type fractions in all samples
|
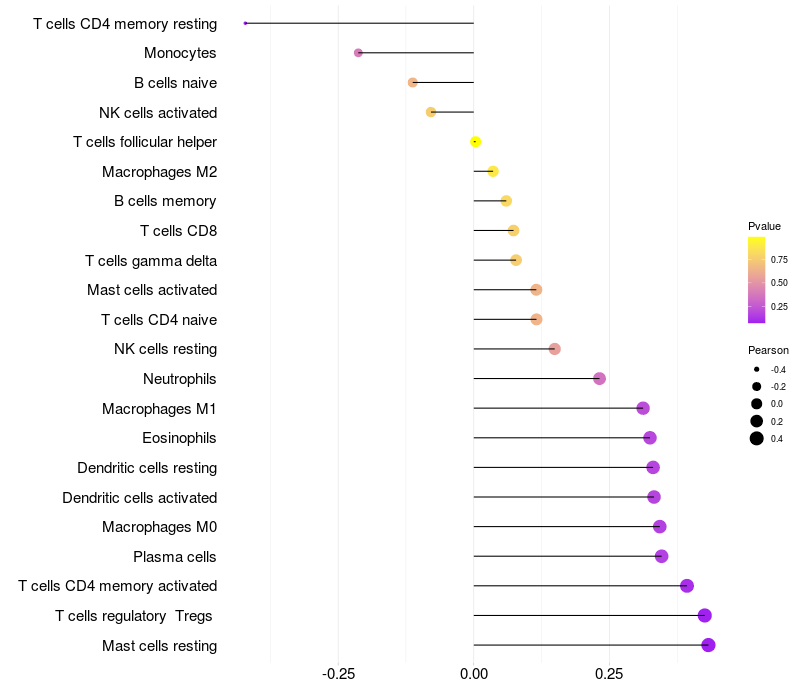
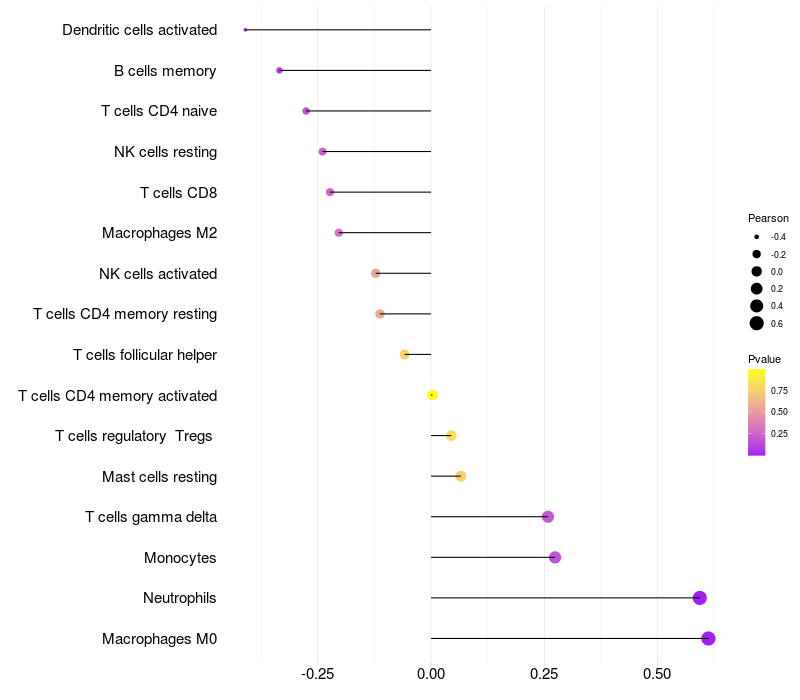
Lollipop of MAPK3 expression and immune infiltrating cell level correlation result in HTLV1+ samples
|
MAPK3 expression: Low -> High
|
|
|
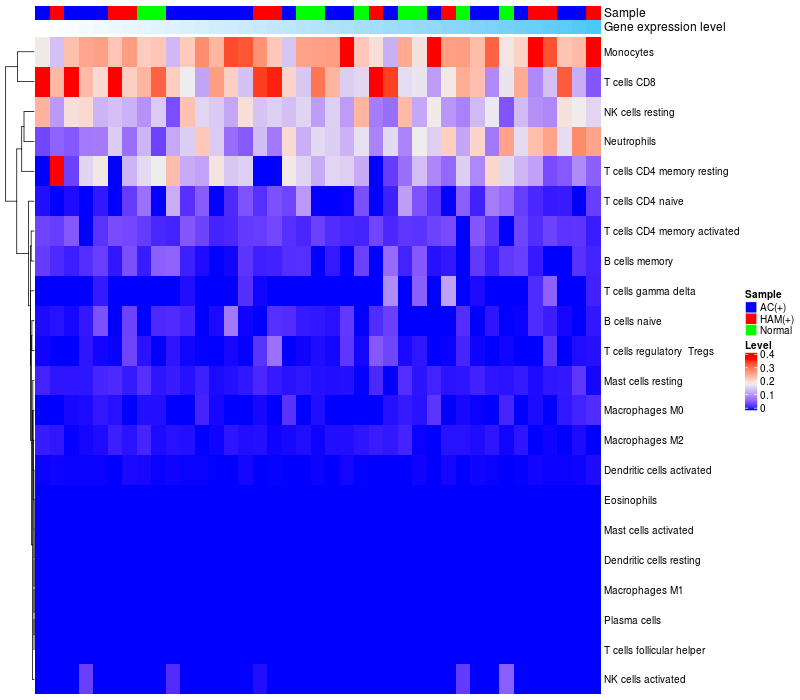
> Dataset: GSE29312
|
|
HeatMap of cell type fractions in all samples
|
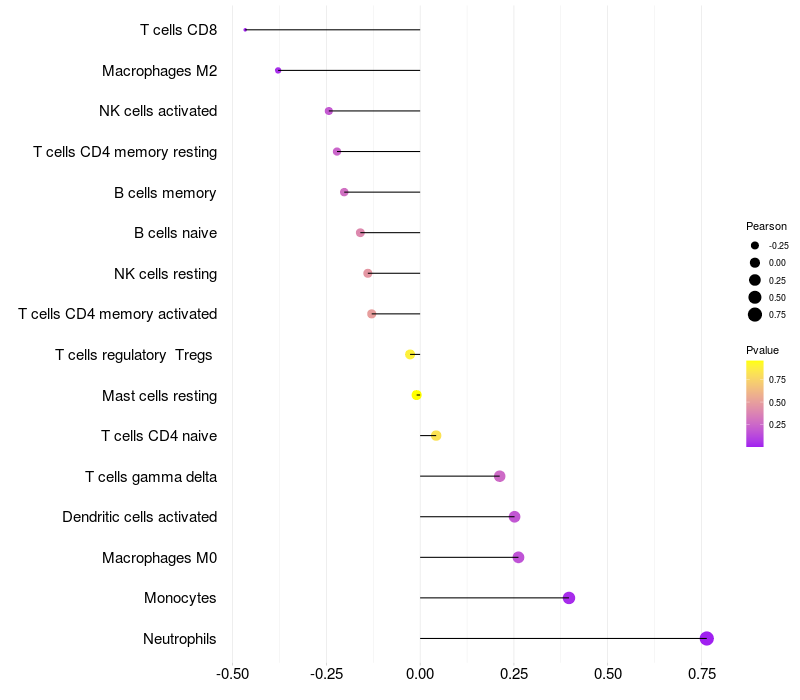
Lollipop of MAPK3 expression and immune infiltrating cell level correlation result in HTLV1+ samples
|
MAPK3 expression: Low -> High
|
|
|
> Dataset: GSE29332
|
|
HeatMap of cell type fractions in all samples
|
Lollipop of MAPK3 expression and immune infiltrating cell level correlation result in HTLV1+ samples
|
MAPK3 expression: Low -> High
|
|
|
|
|

 HTLV1 Target gene Detail Information