|
|||||||||
|
|
|||||||||
 HPV Target gene Detail Information
|
Gene Information
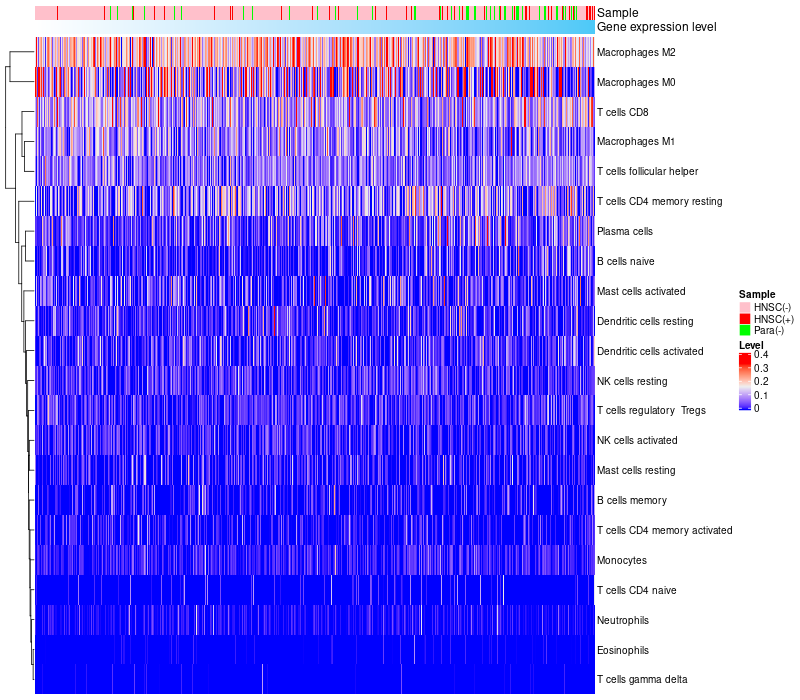
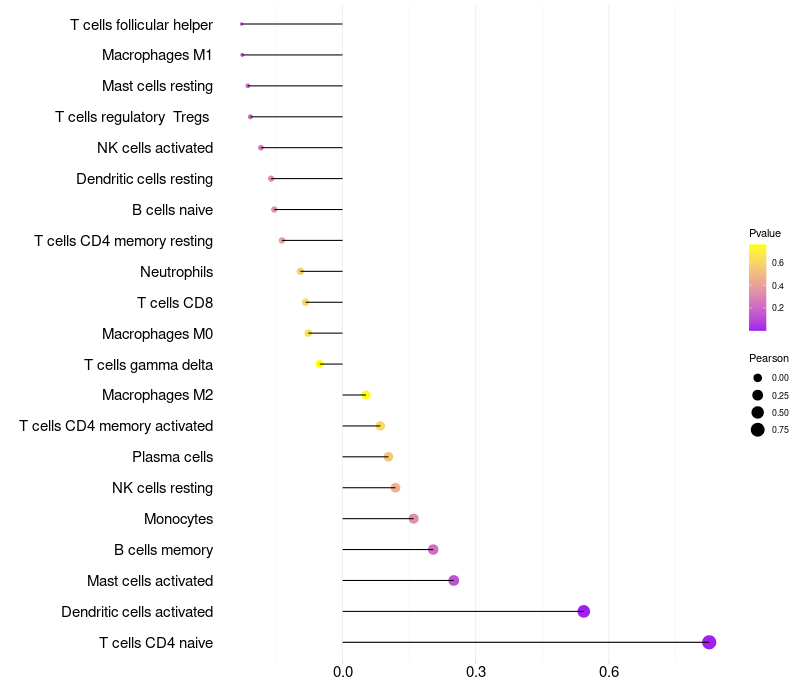
Target gene [MAP3K15] related to VISs

Relationship between gene expression and immune infiltrating cell level
|
|||||||||||||||||||||||||||||||||||||||||||||||||||||||||||||||