|
Gene Information
|
Gene Name
|
LCT |
|
Gene ID
|
3938
|
|
Gene Full Name
|
lactase |
|
Gene Alias
|
LAC; LPH; LPH1 |
|
Transcripts
|
ENSG00000115850
|
|
Virus
|
HTLV1 |
|
Gene Type
|
protein coding |
|
HPA Location Info
|

|
|
Membrane Info
|
Predicted membrane proteins |
|
HPA Protein Class Info
|
Disease related genes, Enzymes, Plasma proteins, Potential drug targets, Predicted membrane proteins |
|
Uniport_ID
|
P09848
|
|
HGNC ID
|
HGNC:6530
|
|
VEGA ID
|
OTTHUMG00000131738
|
|
OMIM ID
|
603202 |
|
String ID
|
9606.ENSP00000264162
|
|
Drugbank ID
|
BE0004338
|
|
PharmGKB ID
|
PA30315
|
Target gene [LCT] related to VISs 
| DVID |
Chromosome |
HM |
TFBS |
CA |
Sum of Overlapped Records |
Detail |
| 6006608 |
chr13 |
60 |
6 |
|
66 |
View |
| 6011757 |
chr13 |
25 |
|
|
25 |
View |
| 6014877 |
chr13 |
14 |
1 |
|
15 |
View |
| 6023115 |
chr2 |
3 |
1 |
|
4 |
View |
| 6023677 |
chr13 |
|
4 |
|
4 |
View |
Relationship between gene expression and immune infiltrating cell level
| Data ID |
Disease |
Sample number |
Sample type |
|
GSE55851 (GEO) |
Adult T-cell leukemia |
21 |
Normal (3), Asymptomatic carriers (HTLV1+)(6), Adult T-cell Leukemia-lymphoma (HTLV1+)(12) |
|
GSE29312 (GEO) |
HTLV-1 associated myelopathy |
39 |
Normal (9), Asymptomatic carriers (HTLV1+)(20), HTLV-1-associated myelopathy (HTLV1+)(10) |
|
GSE29332 (GEO) |
HTLV-1 associated myelopathy |
35 |
Normal (8), Asymptomatic carriers (HTLV1+)(17), HTLV-1-associated myelopathy (HTLV1+)(10) |
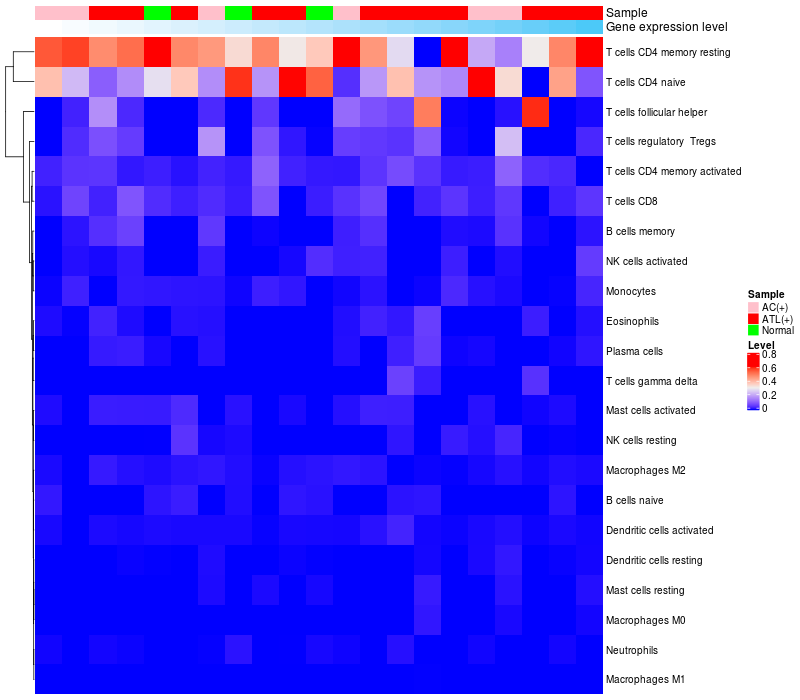
> Dataset: GSE55851
|
|
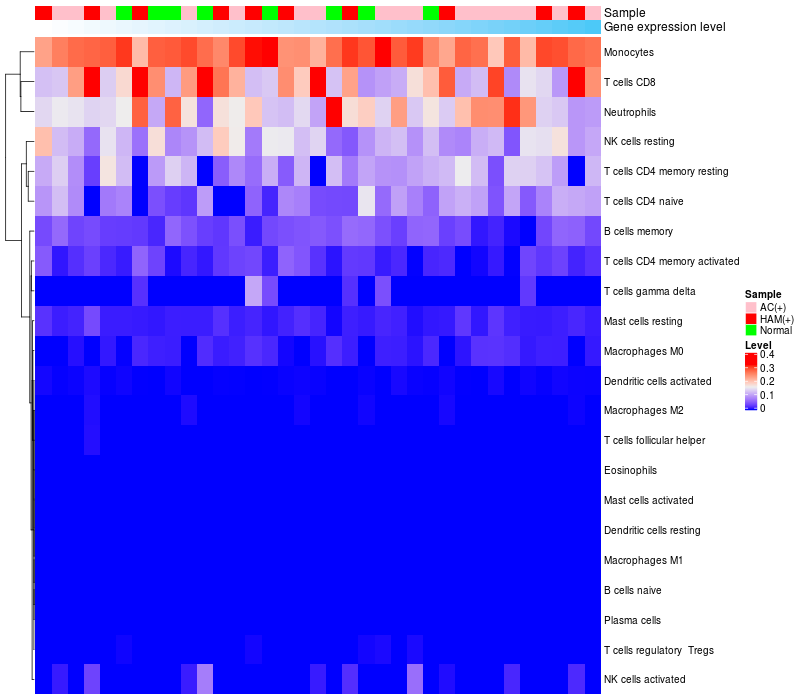
HeatMap of cell type fractions in all samples
|
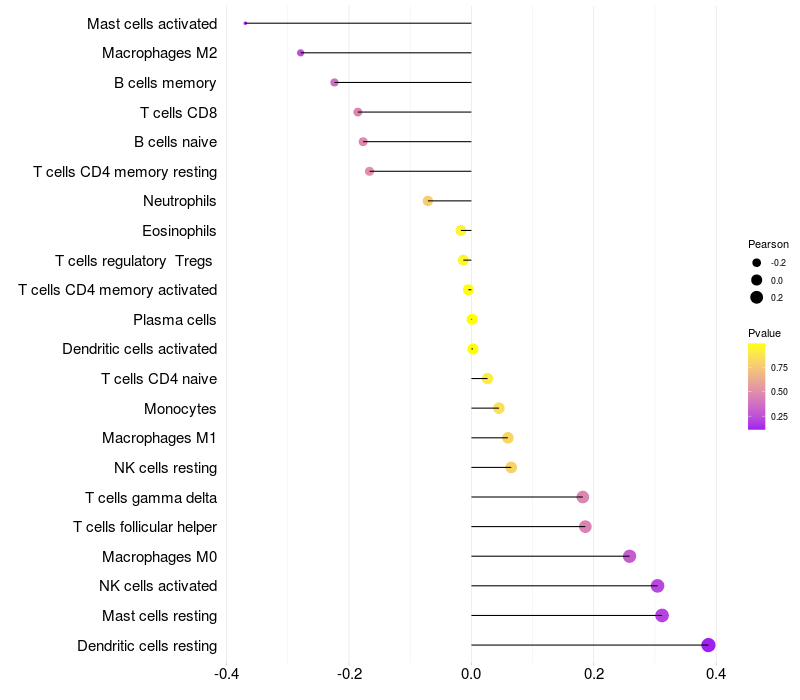
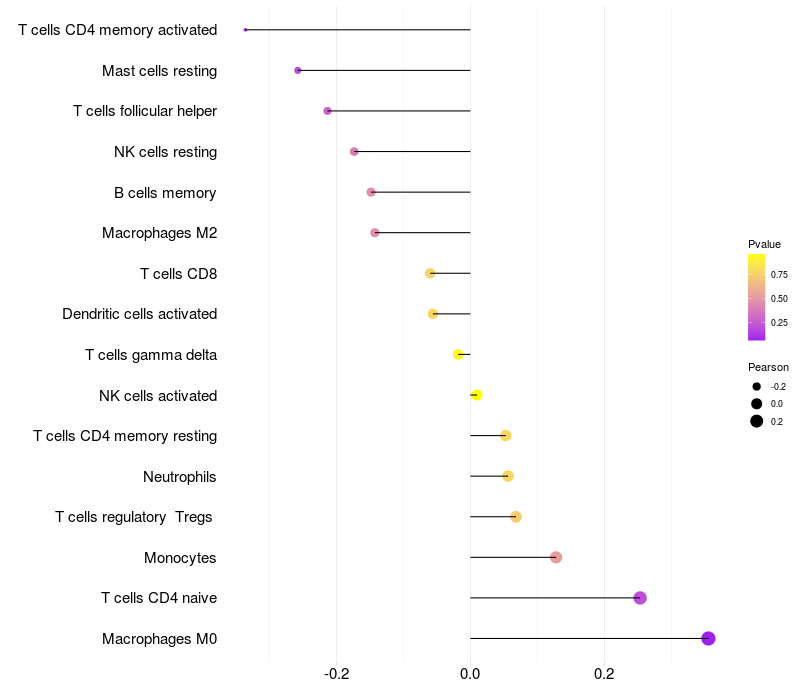
Lollipop of LCT expression and immune infiltrating cell level correlation result in HTLV1+ samples
|
LCT expression: Low -> High
|
|
|
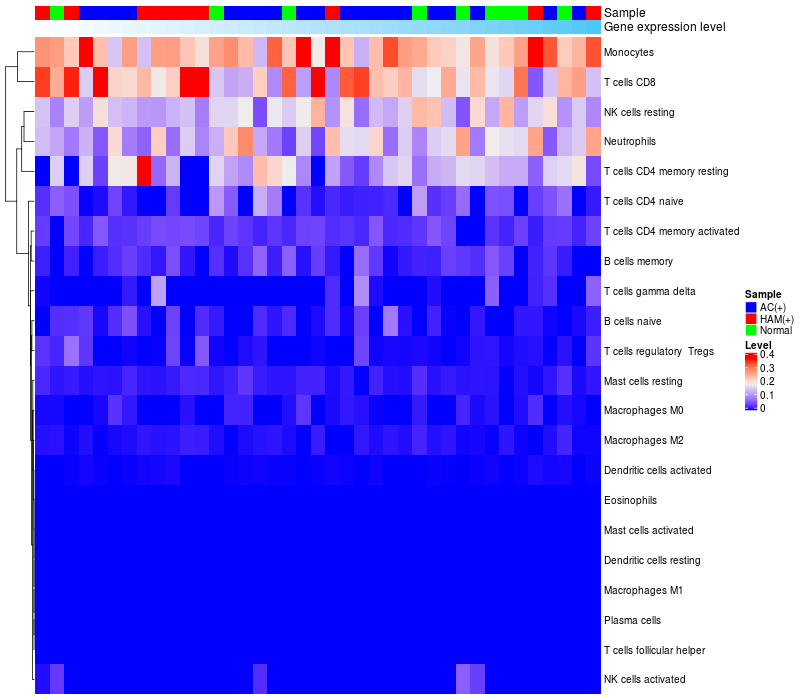
> Dataset: GSE29312
|
|
HeatMap of cell type fractions in all samples
|
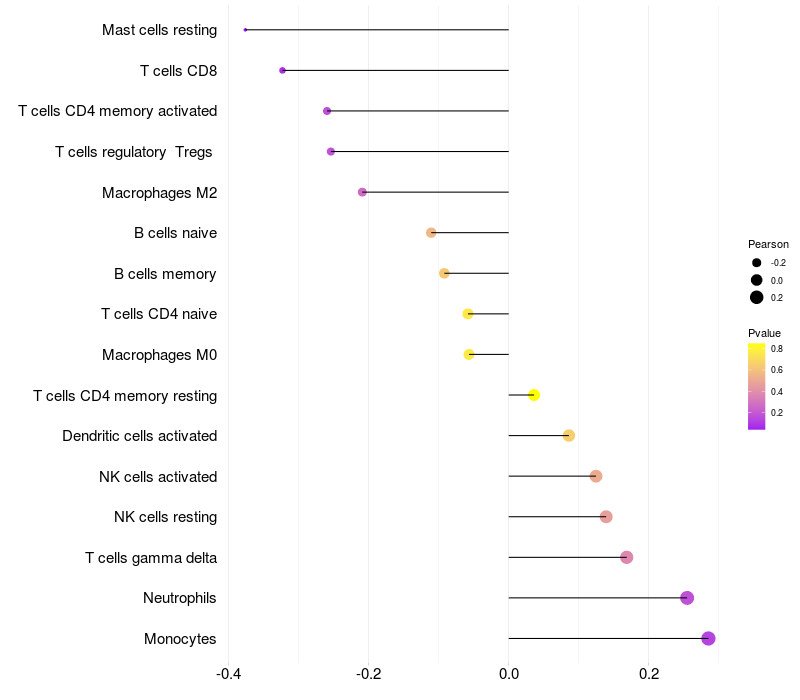
Lollipop of LCT expression and immune infiltrating cell level correlation result in HTLV1+ samples
|
LCT expression: Low -> High
|
|
|
> Dataset: GSE29332
|
|
HeatMap of cell type fractions in all samples
|
Lollipop of LCT expression and immune infiltrating cell level correlation result in HTLV1+ samples
|
LCT expression: Low -> High
|
|
|
|
|

 HTLV1 Target gene Detail Information