|
Gene Information
|
Gene Name
|
KLK11 |
|
Gene ID
|
11012
|
|
Gene Full Name
|
kallikrein related peptidase 11 |
|
Gene Alias
|
TLSP; PRSS20 |
|
Transcripts
|
ENSG00000167757
|
|
Virus
|
HTLV1 |
|
Gene Type
|
protein coding |
|
HPA Location Info
|

|
|
HPA Protein Class Info
|
Cancer-related genes, Enzymes, Plasma proteins, Predicted intracellular proteins, Predicted secreted proteins |
|
Uniport_ID
|
Q9UBX7
|
|
HGNC ID
|
HGNC:6359
|
|
VEGA ID
|
OTTHUMG00000182915
|
|
OMIM ID
|
604434 |
|
String ID
|
9606.ENSP00000473047
|
|
PharmGKB ID
|
PA30148
|
Target gene [KLK11] related to VISs 
| DVID |
Chromosome |
HM |
TFBS |
CA |
Sum of Overlapped Records |
Detail |
| 6017939 |
chr19 |
8 |
2 |
|
10 |
View |
Relationship between gene expression and immune infiltrating cell level
| Data ID |
Disease |
Sample number |
Sample type |
|
GSE55851 (GEO) |
Adult T-cell leukemia |
21 |
Normal (3), Asymptomatic carriers (HTLV1+)(6), Adult T-cell Leukemia-lymphoma (HTLV1+)(12) |
|
GSE29312 (GEO) |
HTLV-1 associated myelopathy |
39 |
Normal (9), Asymptomatic carriers (HTLV1+)(20), HTLV-1-associated myelopathy (HTLV1+)(10) |
|
GSE29332 (GEO) |
HTLV-1 associated myelopathy |
35 |
Normal (8), Asymptomatic carriers (HTLV1+)(17), HTLV-1-associated myelopathy (HTLV1+)(10) |
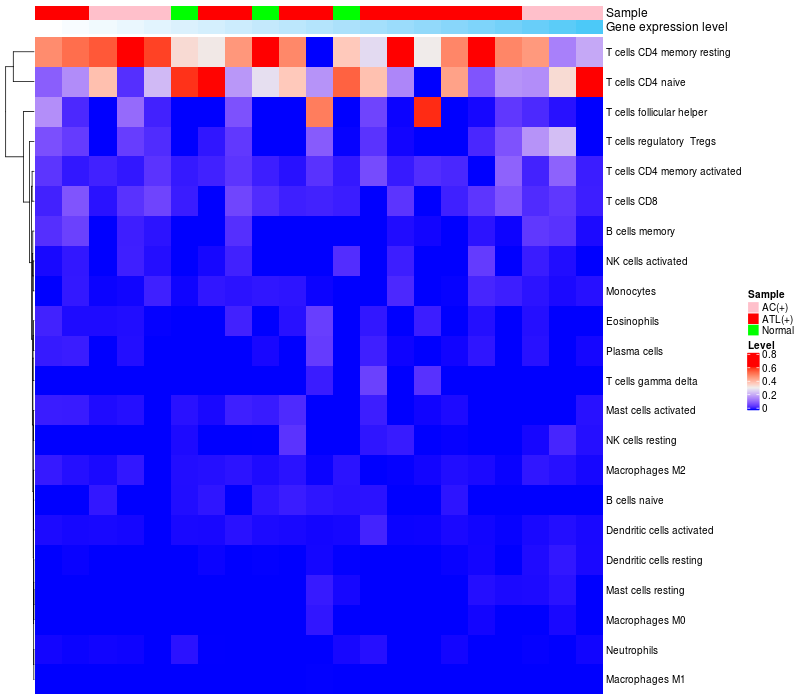
> Dataset: GSE55851
|
|
HeatMap of cell type fractions in all samples
|
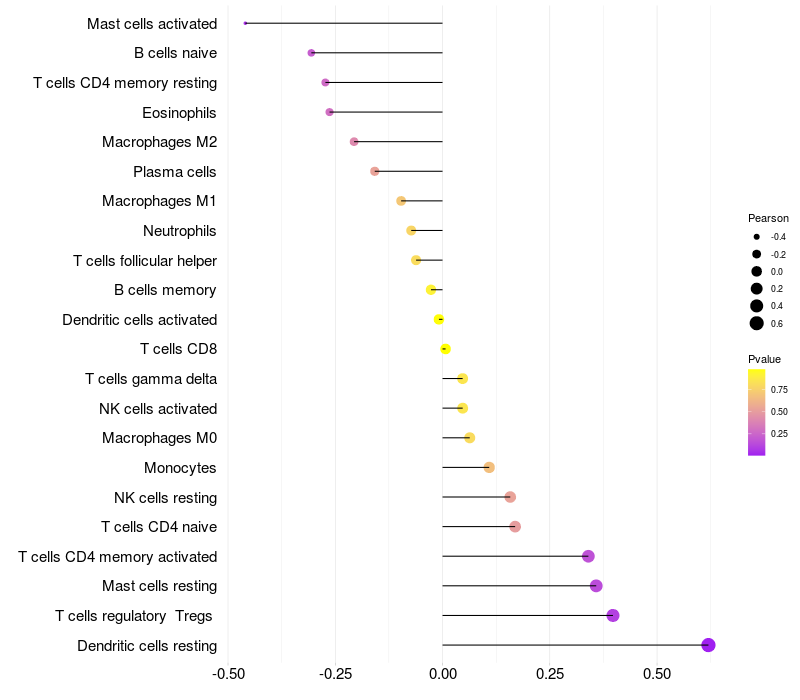
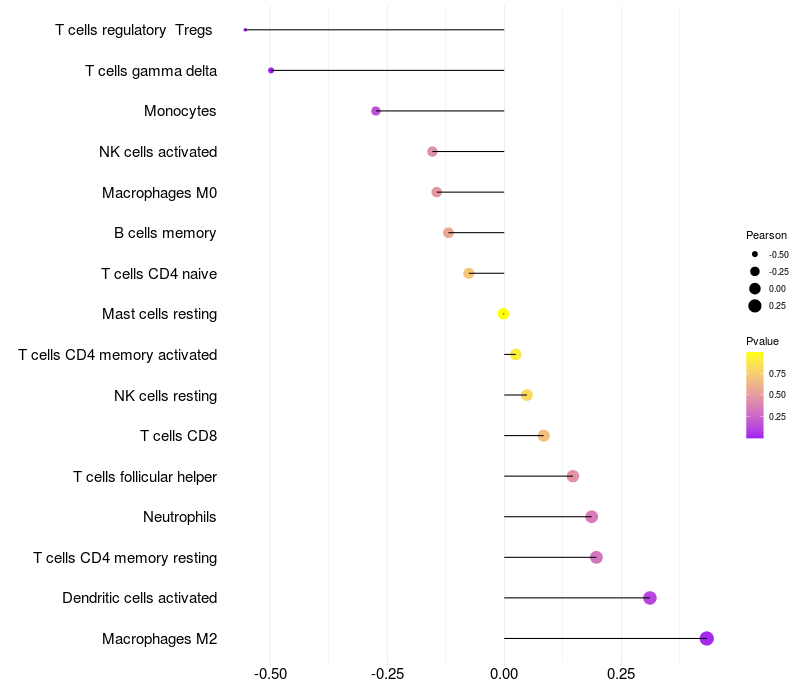
Lollipop of KLK11 expression and immune infiltrating cell level correlation result in HTLV1+ samples
|
KLK11 expression: Low -> High
|
|
|
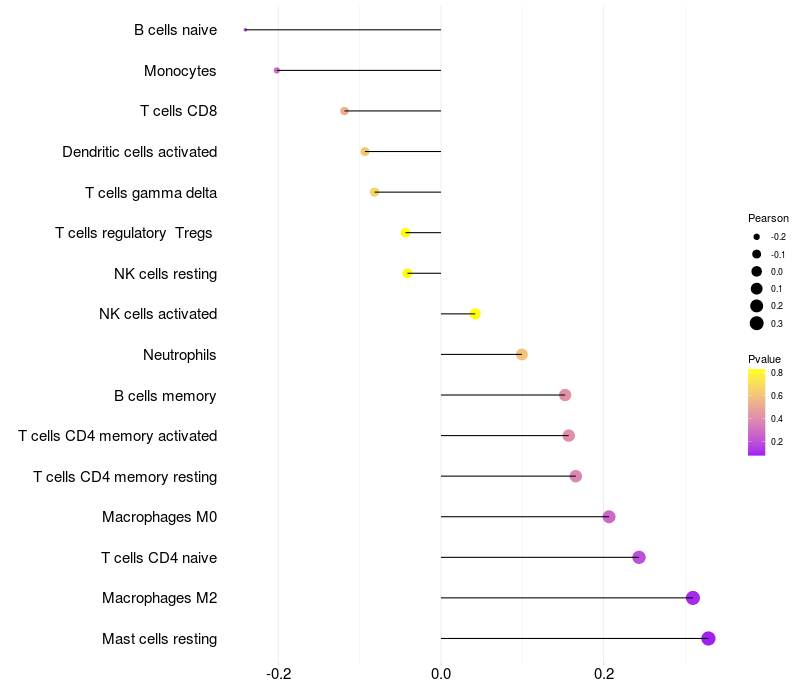
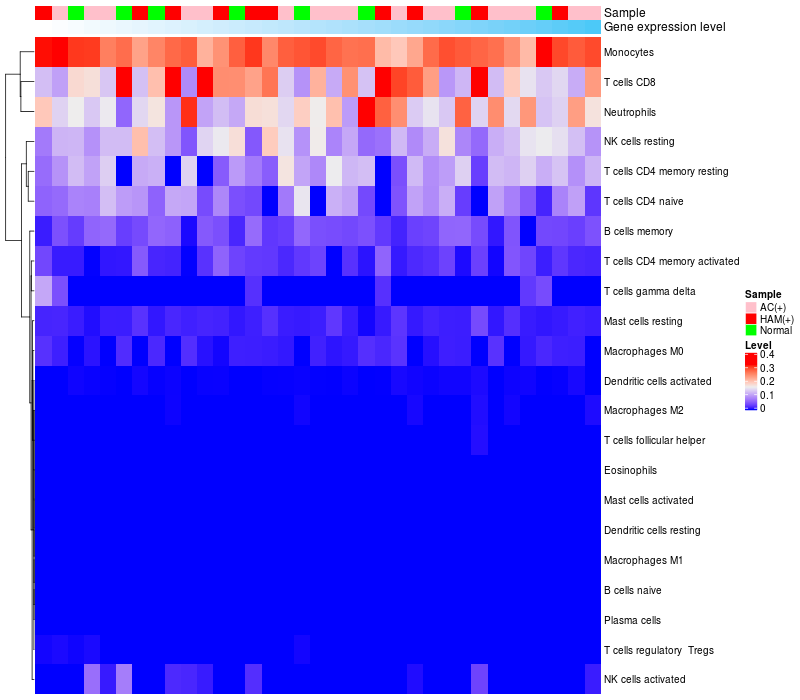
> Dataset: GSE29312
|
|
HeatMap of cell type fractions in all samples
|
Lollipop of KLK11 expression and immune infiltrating cell level correlation result in HTLV1+ samples
|
KLK11 expression: Low -> High

|
|
|
> Dataset: GSE29332
|
|
HeatMap of cell type fractions in all samples
|
Lollipop of KLK11 expression and immune infiltrating cell level correlation result in HTLV1+ samples
|
KLK11 expression: Low -> High
|
|
|
|
|

 HTLV1 Target gene Detail Information