|
Gene Information
|
Gene Name
|
HPGD |
|
Gene ID
|
3248
|
|
Gene Full Name
|
15-hydroxyprostaglandin dehydrogenase |
|
Gene Alias
|
PGDH; PGDH1; PHOAR1; 15-PGDH; SDR36C1 |
|
Transcripts
|
ENSG00000164120
|
|
Virus
|
HTLV1 |
|
Gene Type
|
protein coding |
|
HPA Location Info
|
Cytosol;Nucleoplasm; 
|
|
HPA Protein Class Info
|
Cancer-related genes, Disease related genes, Enzymes, Potential drug targets, Predicted intracellular proteins |
|
Gene Function
|
Suppressor gene
|
|
Uniport_ID
|
P15428
|
|
HGNC ID
|
HGNC:5154
|
|
VEGA ID
|
OTTHUMG00000160772
|
|
OMIM ID
|
601688 |
|
String ID
|
9606.ENSP00000296522
|
|
Drugbank ID
|
BE0000552
|
|
PharmGKB ID
|
PA29424
|
Target gene [HPGD] related to VISs 
| DVID |
Chromosome |
HM |
TFBS |
CA |
Sum of Overlapped Records |
Detail |
| 6001461 |
chr4 |
72 |
186 |
170 |
428 |
View |
| 6022295 |
chr4 |
5 |
|
|
5 |
View |
Relationship between gene expression and immune infiltrating cell level
| Data ID |
Disease |
Sample number |
Sample type |
|
GSE55851 (GEO) |
Adult T-cell leukemia |
21 |
Normal (3), Asymptomatic carriers (HTLV1+)(6), Adult T-cell Leukemia-lymphoma (HTLV1+)(12) |
|
GSE29312 (GEO) |
HTLV-1 associated myelopathy |
39 |
Normal (9), Asymptomatic carriers (HTLV1+)(20), HTLV-1-associated myelopathy (HTLV1+)(10) |
|
GSE29332 (GEO) |
HTLV-1 associated myelopathy |
35 |
Normal (8), Asymptomatic carriers (HTLV1+)(17), HTLV-1-associated myelopathy (HTLV1+)(10) |
> Dataset: GSE55851
|
|
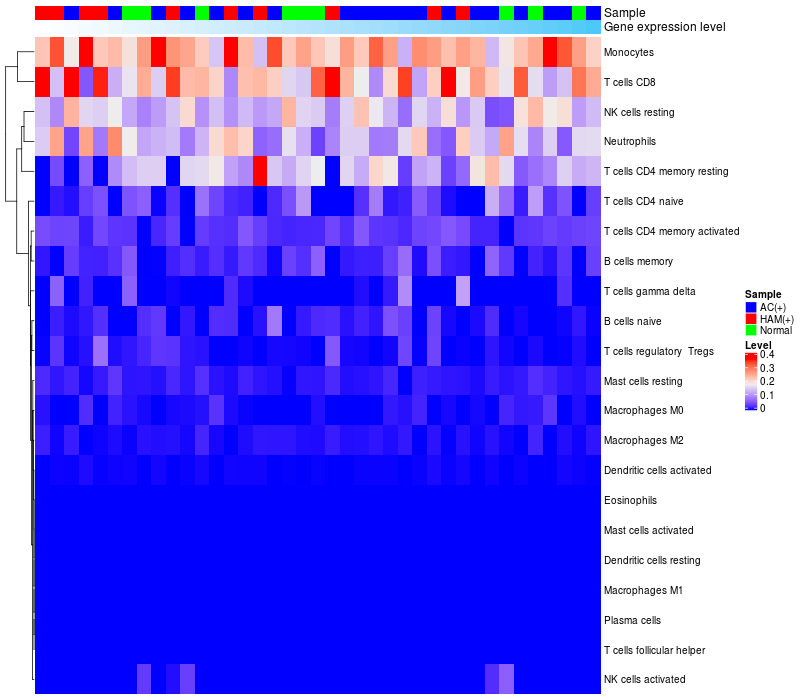
HeatMap of cell type fractions in all samples
|
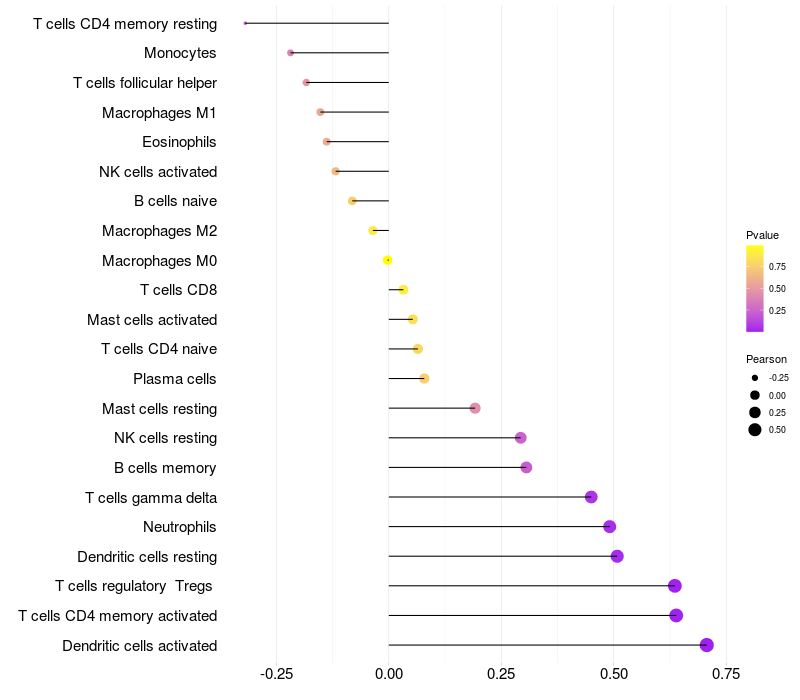
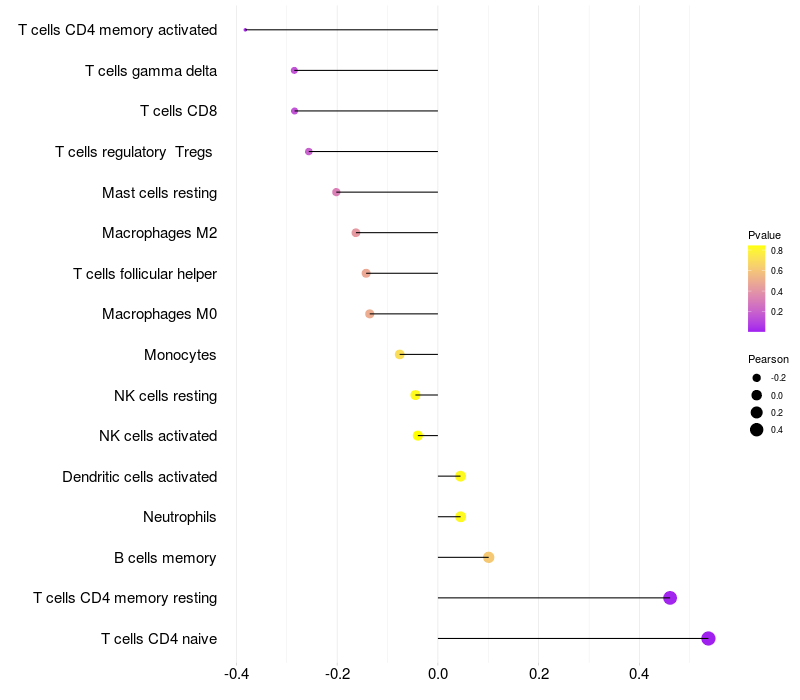
Lollipop of HPGD expression and immune infiltrating cell level correlation result in HTLV1+ samples
|
HPGD expression: Low -> High

|
|
|
> Dataset: GSE29312
|
|
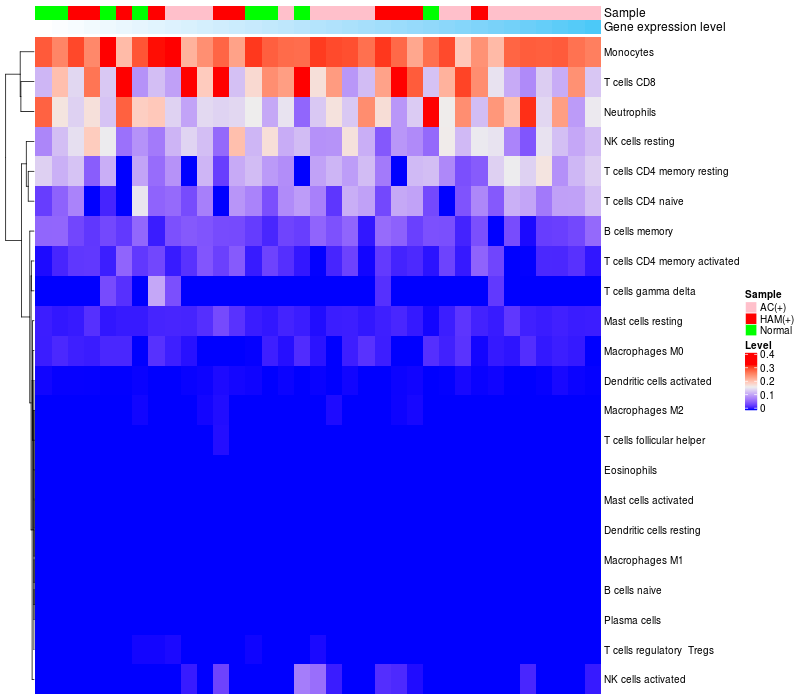
HeatMap of cell type fractions in all samples
|
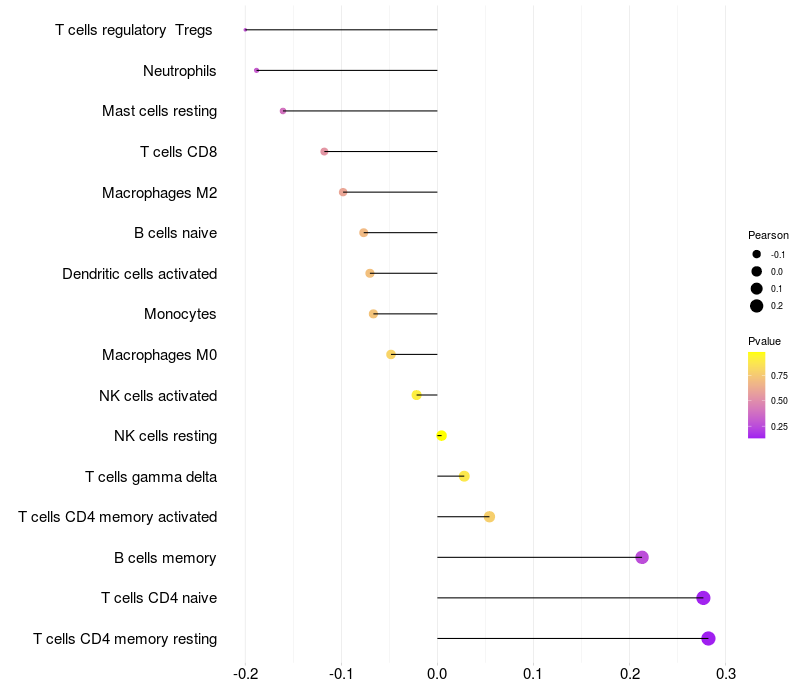
Lollipop of HPGD expression and immune infiltrating cell level correlation result in HTLV1+ samples
|
HPGD expression: Low -> High
|
|
|
> Dataset: GSE29332
|
|
HeatMap of cell type fractions in all samples
|
Lollipop of HPGD expression and immune infiltrating cell level correlation result in HTLV1+ samples
|
HPGD expression: Low -> High
|
|
|
|
|

 HTLV1 Target gene Detail Information