|
Gene Information
|
Gene Name
|
FGF1 |
|
Gene ID
|
2246
|
|
Gene Full Name
|
fibroblast growth factor 1 |
|
Gene Alias
|
AFGF; ECGF; FGFA; ECGFA; ECGFB; FGF-1; HBGF1; HBGF-1; GLIO703; ECGF-beta; FGF-alpha |
|
Transcripts
|
ENSG00000113578
|
|
Virus
|
HTLV1 |
|
Gene Type
|
protein coding |
|
HPA Location Info
|
Nucleoplasm;Predicted to be secreted; 
|
|
HPA Protein Class Info
|
Cancer-related genes, FDA approved drug targets, Predicted intracellular proteins, Predicted secreted proteins, RAS pathway related proteins |
|
Uniport_ID
|
P05230
|
|
HGNC ID
|
HGNC:3665
|
|
VEGA ID
|
OTTHUMG00000059703
|
|
OMIM ID
|
131220 |
|
String ID
|
9606.ENSP00000480791
|
|
Drugbank ID
|
BE0000689
|
|
PharmGKB ID
|
PA28105
|
Target gene [FGF1] related to VISs 
| DVID |
Chromosome |
HM |
TFBS |
CA |
Sum of Overlapped Records |
Detail |
| 6005778 |
chr5 |
64 |
4 |
13 |
81 |
View |
| 6007074 |
chr5 |
27 |
20 |
13 |
60 |
View |
Relationship between gene expression and immune infiltrating cell level
| Data ID |
Disease |
Sample number |
Sample type |
|
GSE55851 (GEO) |
Adult T-cell leukemia |
21 |
Normal (3), Asymptomatic carriers (HTLV1+)(6), Adult T-cell Leukemia-lymphoma (HTLV1+)(12) |
|
GSE29312 (GEO) |
HTLV-1 associated myelopathy |
39 |
Normal (9), Asymptomatic carriers (HTLV1+)(20), HTLV-1-associated myelopathy (HTLV1+)(10) |
|
GSE29332 (GEO) |
HTLV-1 associated myelopathy |
35 |
Normal (8), Asymptomatic carriers (HTLV1+)(17), HTLV-1-associated myelopathy (HTLV1+)(10) |
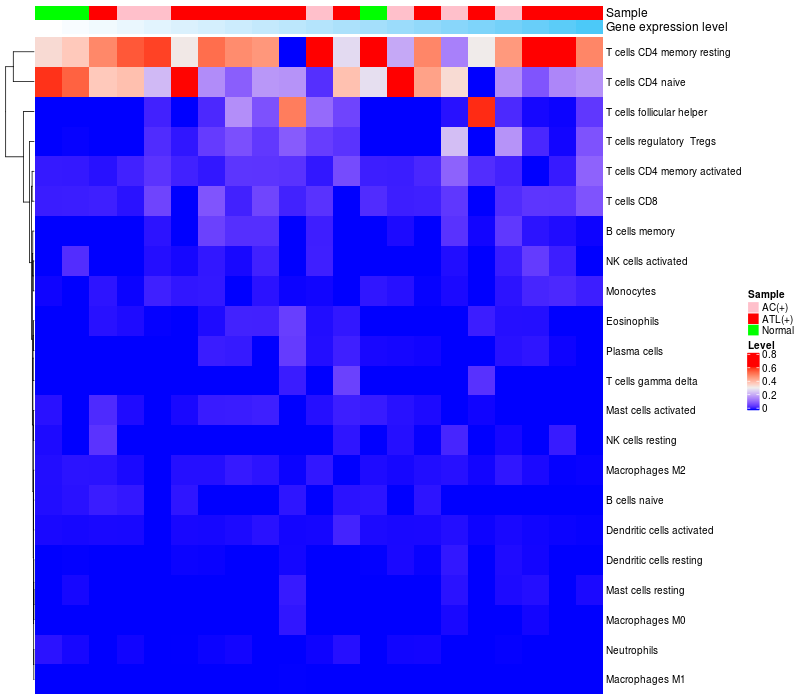
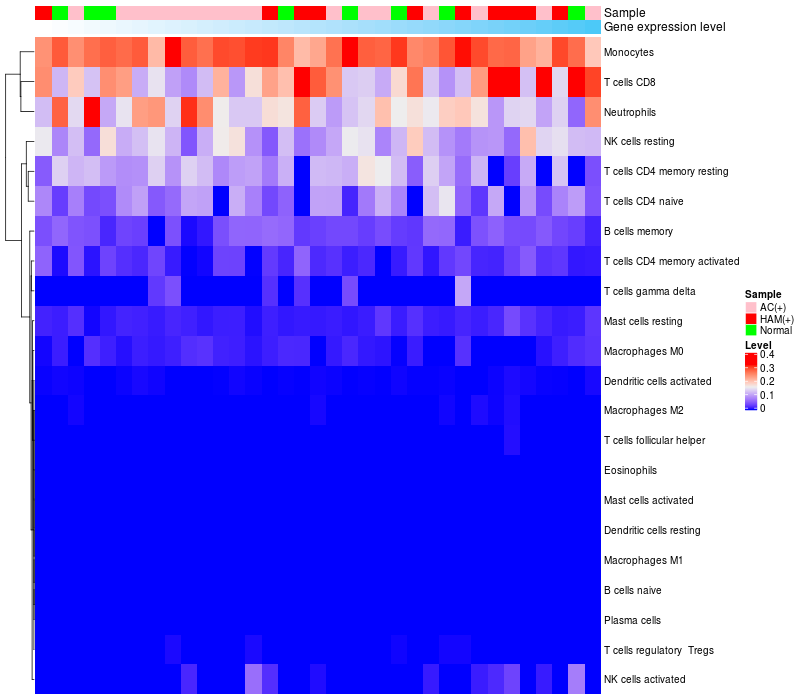
> Dataset: GSE55851
|
|
HeatMap of cell type fractions in all samples
|
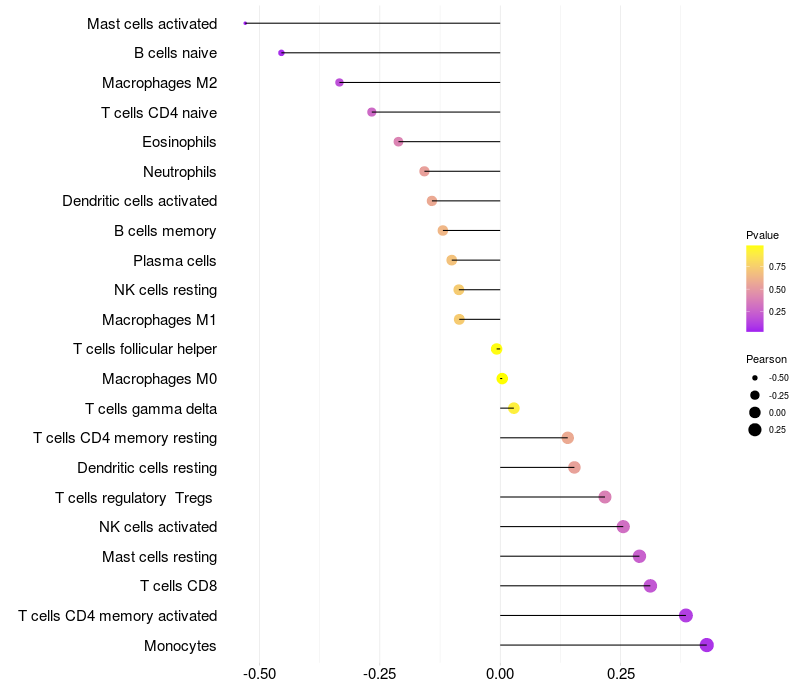
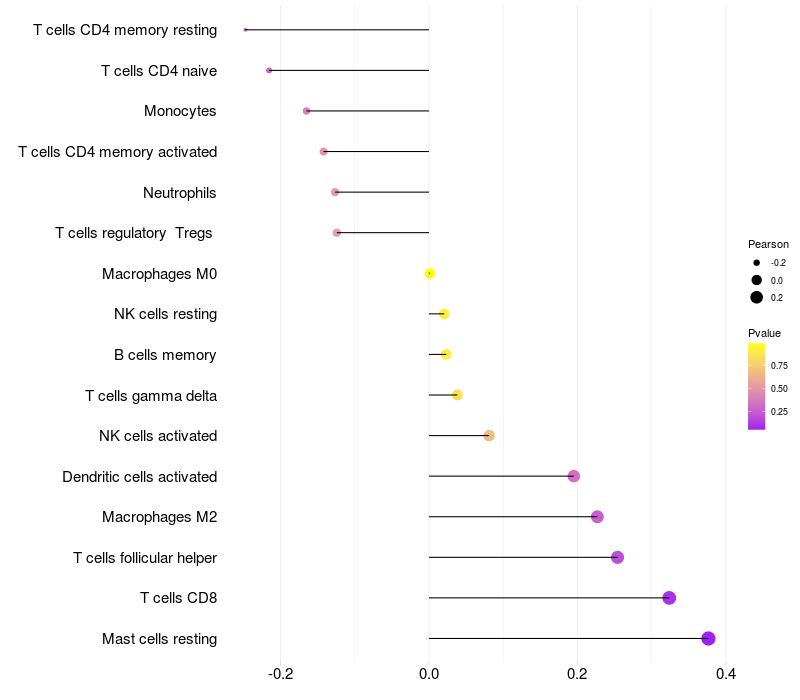
Lollipop of FGF1 expression and immune infiltrating cell level correlation result in HTLV1+ samples
|
FGF1 expression: Low -> High
|
|
|
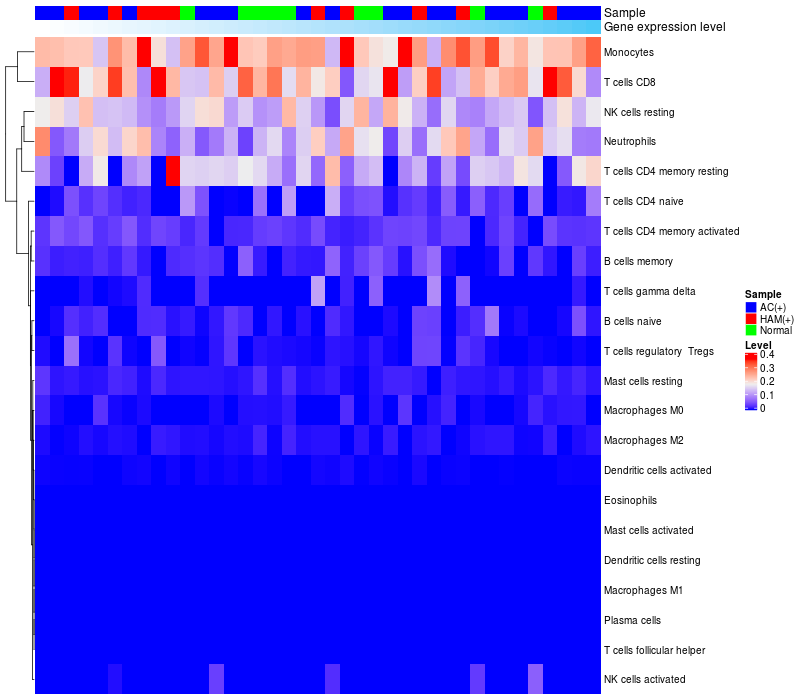
> Dataset: GSE29312
|
|
HeatMap of cell type fractions in all samples
|
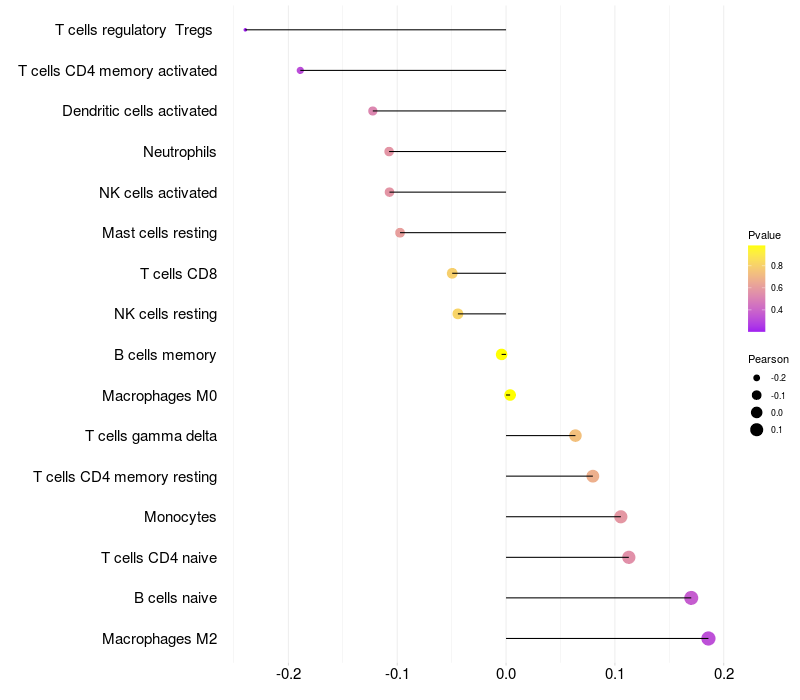
Lollipop of FGF1 expression and immune infiltrating cell level correlation result in HTLV1+ samples
|
FGF1 expression: Low -> High
|
|
|
> Dataset: GSE29332
|
|
HeatMap of cell type fractions in all samples
|
Lollipop of FGF1 expression and immune infiltrating cell level correlation result in HTLV1+ samples
|
FGF1 expression: Low -> High
|
|
|
|
|

 HTLV1 Target gene Detail Information