|
Gene Information
|
Gene Name
|
C3 |
|
Gene ID
|
718
|
|
Gene Full Name
|
complement C3 |
|
Gene Alias
|
ASP; C3a; C3b; AHUS5; ARMD9; CPAMD1; HEL-S-62p |
|
Transcripts
|
ENSG00000125730
|
|
Virus
|
HBV |
|
Gene Type
|
protein coding |
|
HPA Location Info
|

|
|
HPA Protein Class Info
|
Candidate cardiovascular disease genes, Disease related genes, FDA approved drug targets, Plasma proteins, Predicted intracellular proteins, Predicted secreted proteins |
|
Uniport_ID
|
P01024
|
|
HGNC ID
|
HGNC:1318
|
|
VEGA ID
|
OTTHUMG00000150335
|
|
OMIM ID
|
120700 |
|
String ID
|
9606.ENSP00000245907
|
|
Drugbank ID
|
BE0001472;
BE0003455
|
|
PharmGKB ID
|
PA25897
|
Target gene [C3] related to VISs 
Relationship between gene expression and immune infiltrating cell level
| Data ID |
Disease |
Sample number |
Sample type |
|
GSE114783 (GEO) |
Chronic HBV (CHB) infection |
36 |
Chronic hepatitis B patients (HBV+)(10),Hepatocellular carcinoma (HBV+)(10),Liver cirrhosis(HBV+)(10),Normal(3),HBV carriers (3) |
|
GSE114783 (GEO) |
Hepatocellular carcinoma |
36 |
Chronic hepatitis B patients (HBV+)(10),Hepatocellular carcinoma (HBV+)(10),Liver cirrhosis(HBV+)(10),Normal(3),HBV carriers (3) |
|
GSE114783 (GEO) |
Liver cirrhosis |
36 |
Chronic hepatitis B patients (HBV+)(10),Hepatocellular carcinoma (HBV+)(10),Liver cirrhosis(HBV+)(10),Normal(3),HBV carriers (3) |
|
LIHC (TCGA) |
Liver hepatocellular carcinoma |
424 |
Liver hepatocellular carcinoma HCV (HBV+)(86), Liver hepatocellular carcinoma HCV (HBV-)(19), Liver hepatocellular carcinoma (HBV+)(209), Liver hepatocellular carcinoma (HBV+)(60), Paracancerous HCV (HBV+)(4), Paracancerous (HBV-)(28), Paracancerous (HBV+)(18) |
> Dataset: GSE114783
|
|
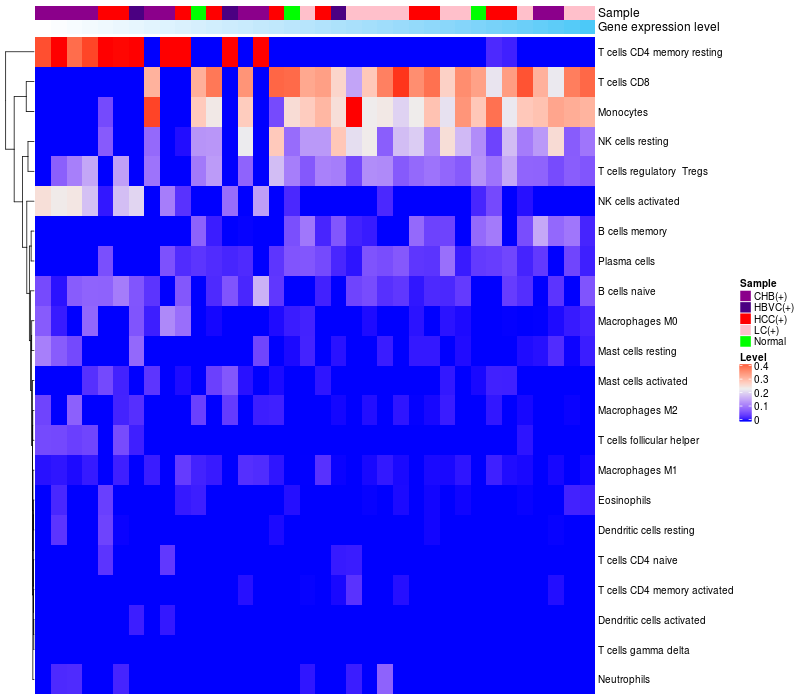
HeatMap of cell type fractions in all samples
|
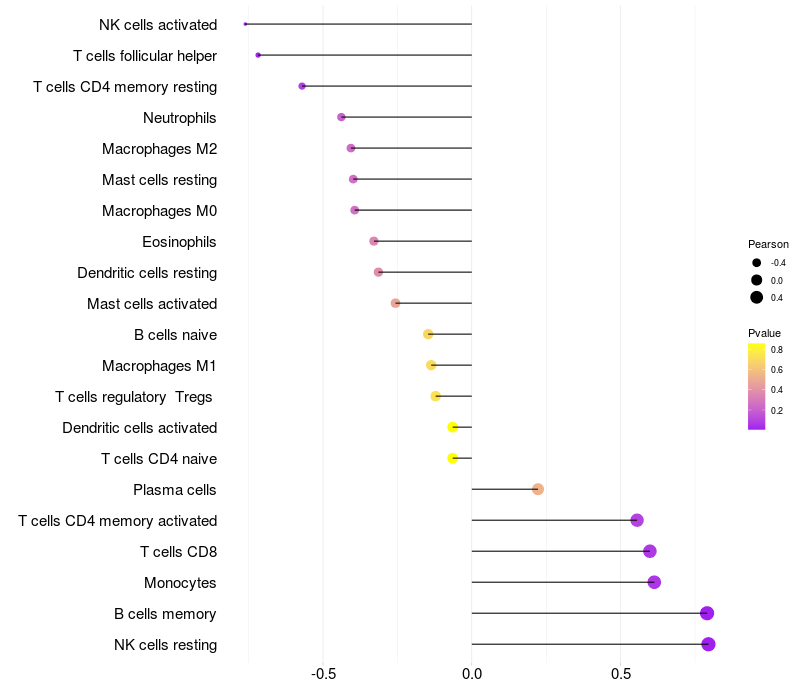
Lollipop of C3 expression and immune infiltrating cell level correlation result in HBV+ Chronic HBV (CHB) infection samples
|
C3 expression: Low -> High
|
|
|
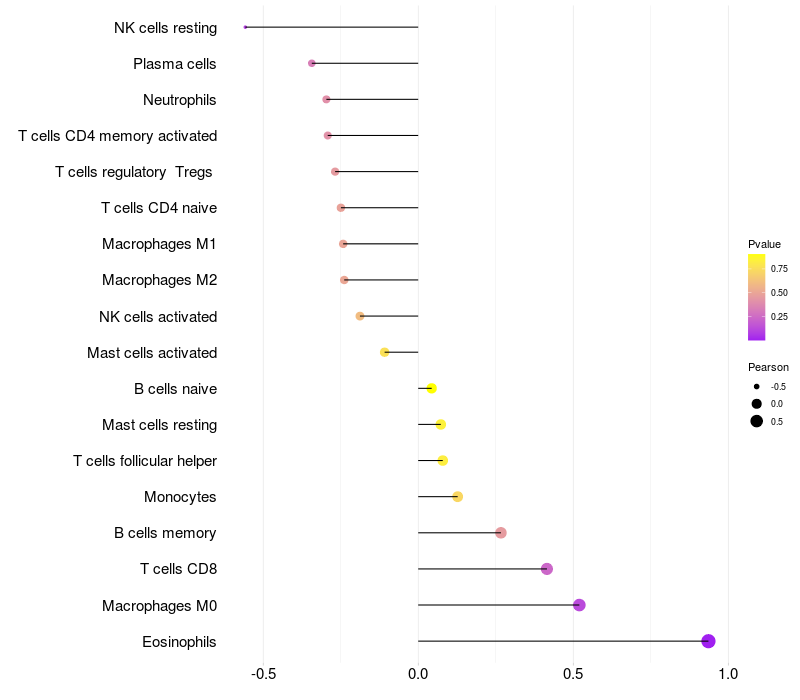
Lollipop of C3 expression and immune infiltrating cell level correlation result in HBV+ Liver cirrhosis samples
|
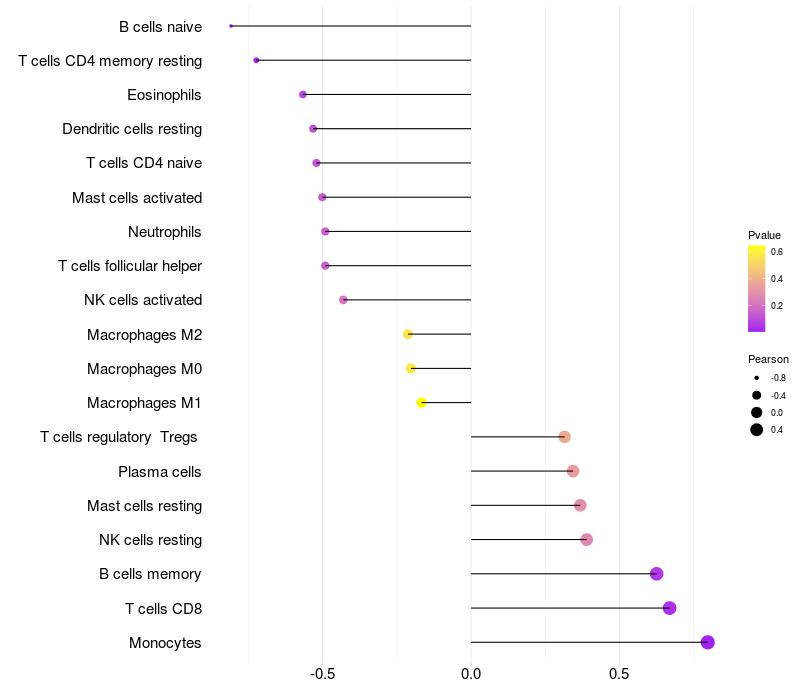
Lollipop of C3 expression and immune infiltrating cell level correlation result in HBV+ Hepatocellular carcinoma samples
|
|
|
|
> Dataset: LIHC
|
|
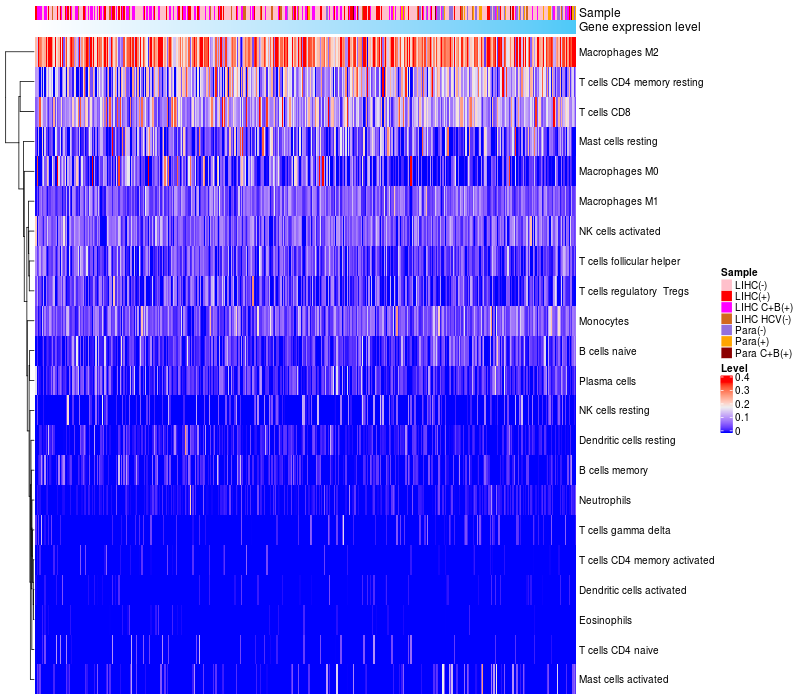
HeatMap of cell type fractions in all samples
|
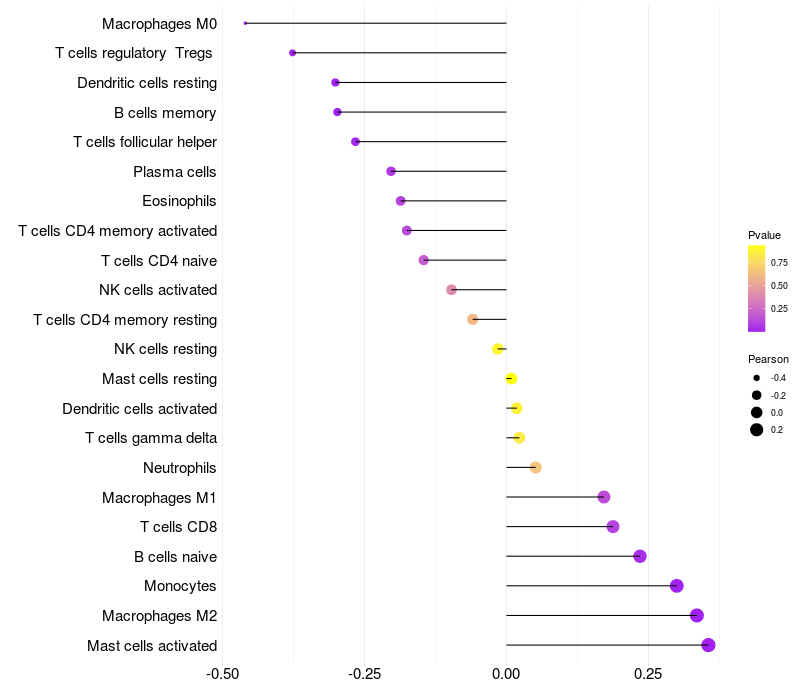
Lollipop of C3 expression and immune infiltrating cell level correlation result in HBV+ samples
|
C3 expression: Low -> High
|
|
|
|
|
 HBV Target gene Detail Information