EBV Target gene Detail Information

> ARHGEF26-AS1 Gene Search Result


Gene Information
Gene Name ARHGEF26-AS1
Gene ID 100507524
Gene Full Name ARHGEF26 antisense RNA 1
Transcripts ENSG00000243069
Virus EBV
Gene Type ncRNA
HPA Location Info
HGNC ID HGNC:41048
lncRNASNP2 ID NONHSAG036436.2
Target gene [ARHGEF26-AS1] related to VISs
DVID Chromosome HM TFBS CA Sum of Overlapped Records Detail
3300225 chr3 85 73 34 192 View

Relationship between gene expression and immune infiltrating cell level
Data ID Disease Sample number Sample type
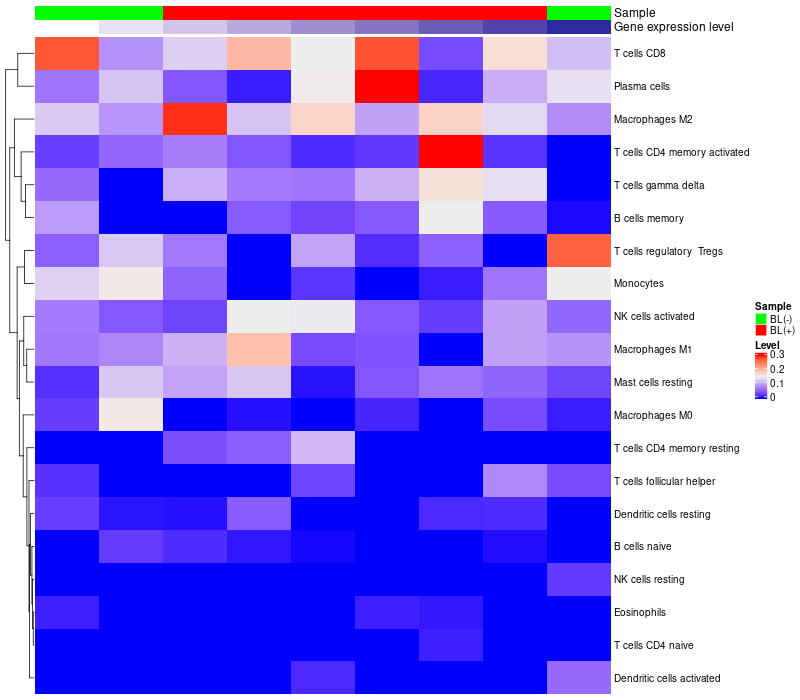
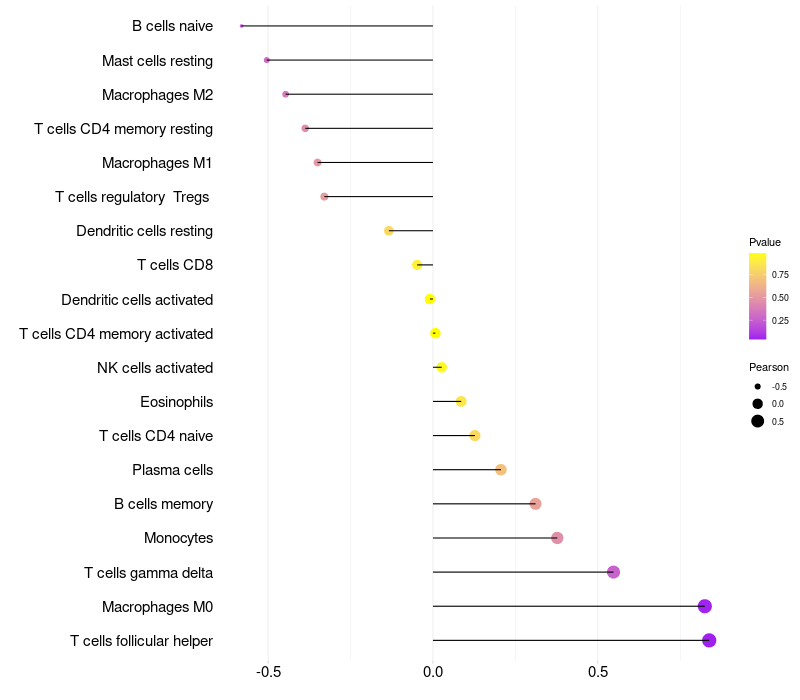
GSE102203 (GEO) B-cell lymphoma 9 Plasmablastic lymphomas (EBV+)(6), Plasmablastic lymphomas (EBV-)(3)
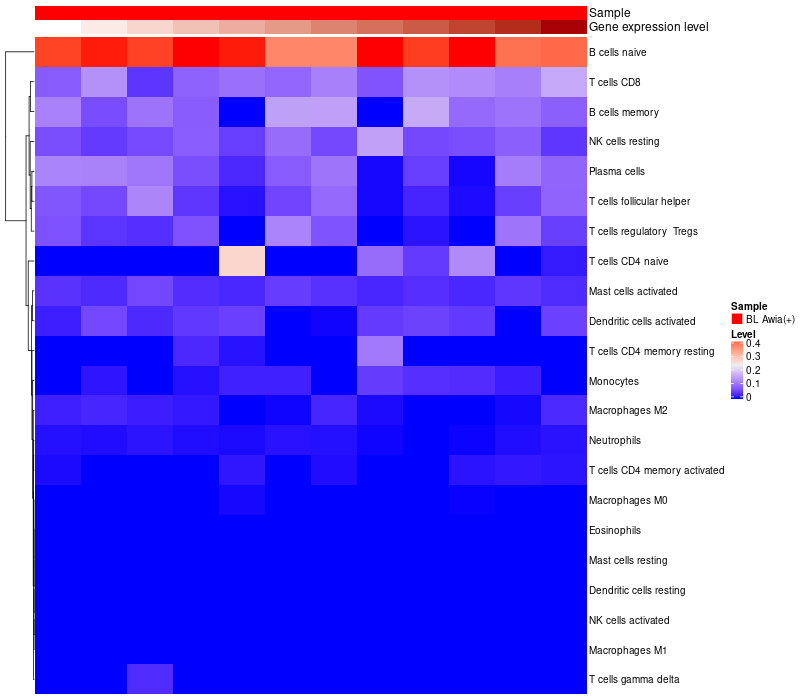
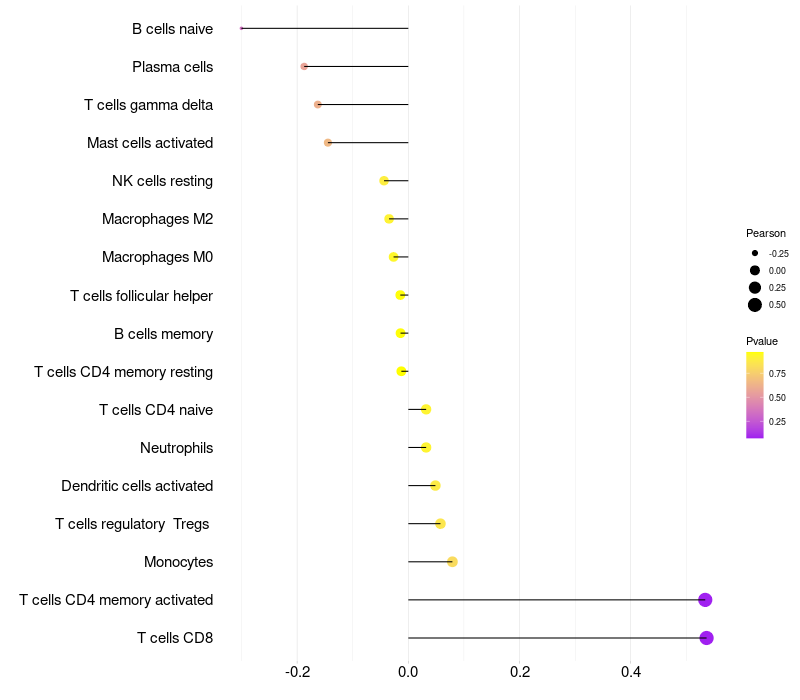
GSE42867 (GEO) Burkitt lymphoma 12 Burkitt lymphoma cell line Awia (EBV+)(12)
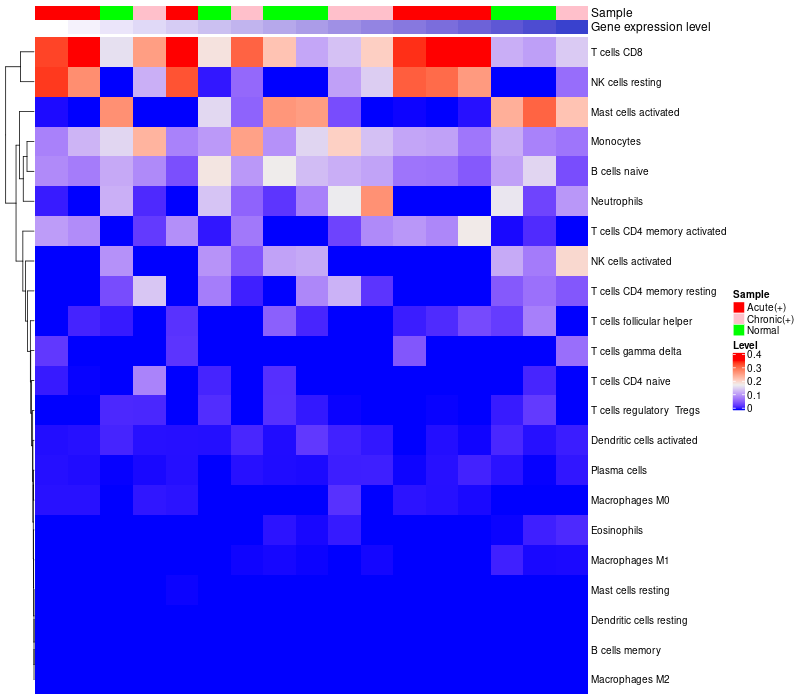
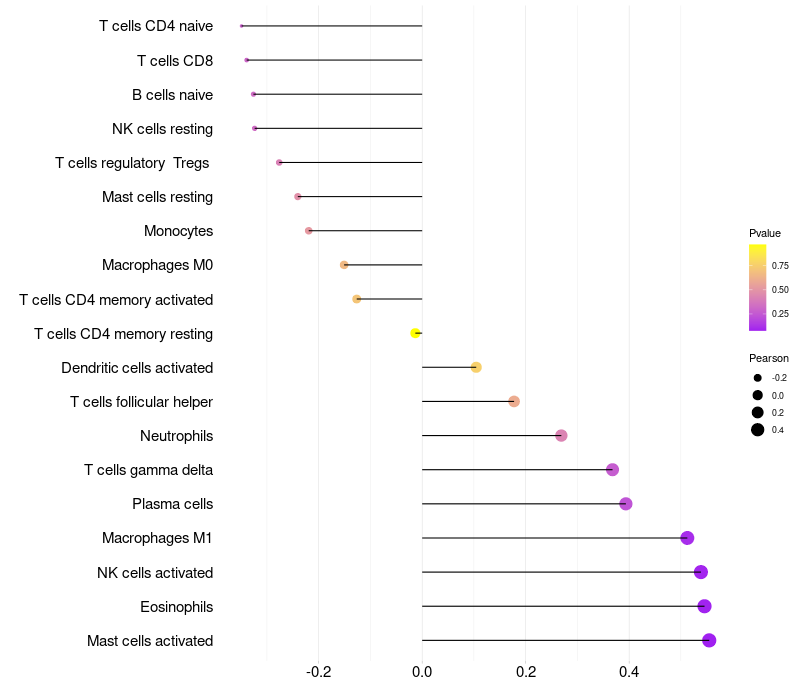
GSE85599 (GEO) Infectious mononucleosis 17 Chronic active EBV infection (EBV+)(5), Acute infectious mononucleosis (EBV+)(6), Normal (6)
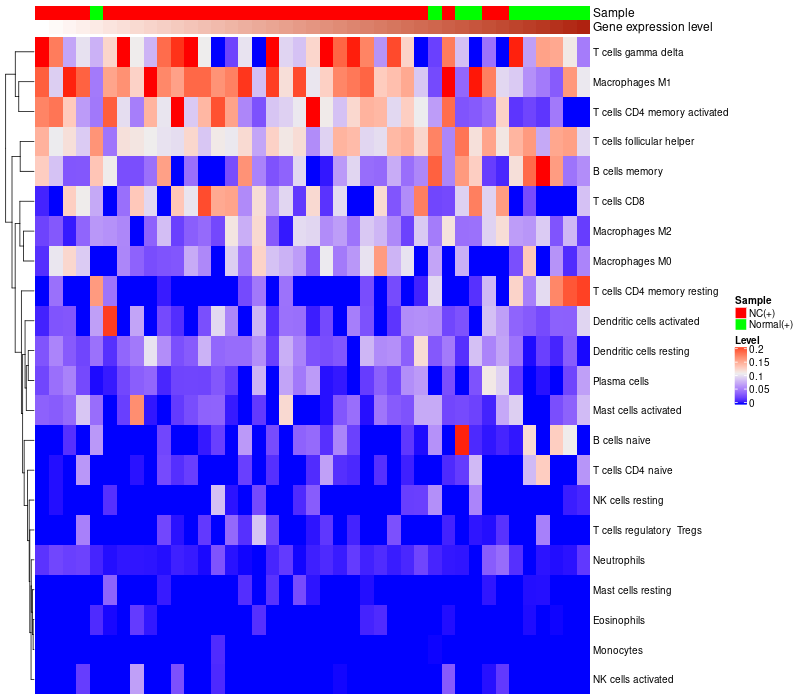
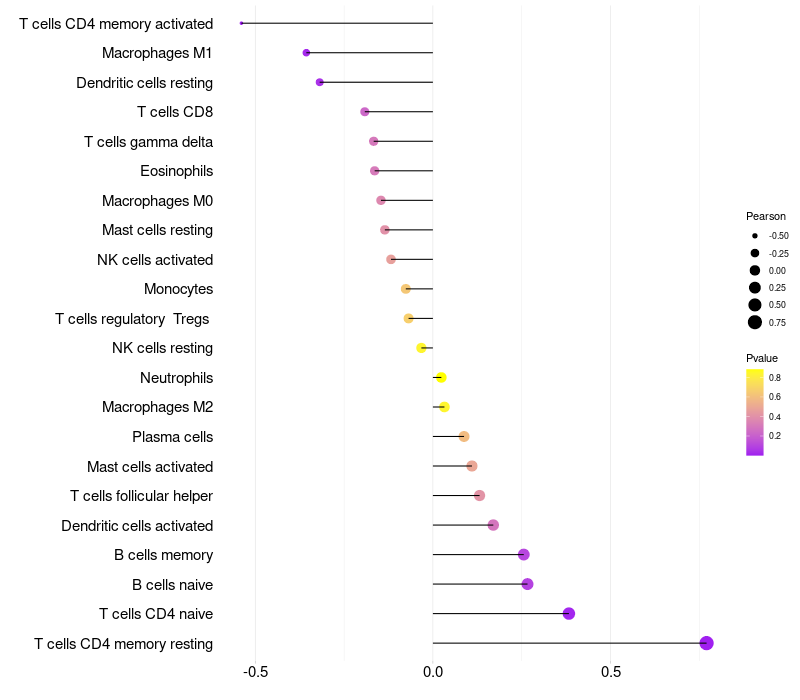
GSE12452 (GEO) Nasopharyngeal carcinoma 41 Nasopharyngeal carcinoma (EBV+)(31), Normal(10)

> Dataset: GSE102203

HeatMap of cell type fractions in all samples Lollipop of ARHGEF26-AS1 expression and immune infiltrating cell level correlation result in EBV+ samples
ARHGEF26-AS1 expression: Low -> High

> Dataset: GSE42867

HeatMap of cell type fractions in all samples Lollipop of ARHGEF26-AS1 expression and immune infiltrating cell level correlation result in EBV+ samples
ARHGEF26-AS1 expression: Low -> High

> Dataset: GSE85599

HeatMap of cell type fractions in all samples Lollipop of ARHGEF26-AS1 expression and immune infiltrating cell level correlation result in EBV+ samples
ARHGEF26-AS1 expression: Low -> High

> Dataset: GSE12452

HeatMap of cell type fractions in all samples Lollipop of ARHGEF26-AS1 expression and immune infiltrating cell level correlation result in EBV+ samples
ARHGEF26-AS1 expression: Low -> High

Contents
Description

Gene Information Note

  • Integration Table: if previous studies reported that target gene was altered by virus integration events, the overlap between VISs in this literature and Cistrome factors was listed in the "Target gene [gene] related to VIS" section

Immune Analysis Plot Note

  • Left: Heatmap of target gene expression and the level of various types of immune cells (cell type fractions) in all samples based on CIBERSORT method.
  • Right: Correlation of target gene expression and the level of various types of immune cells in virus positive samples (Pearson Correlation Coefficient).