|
Gene Information
|
Gene Name
|
AR |
|
Gene ID
|
367
|
|
Gene Full Name
|
androgen receptor |
|
Gene Alias
|
KD; AIS; AR8; TFM; DHTR; SBMA; HYSP1; NR3C4; SMAX1; HUMARA |
|
Transcripts
|
ENSG00000169083
|
|
Virus
|
HTLV1 |
|
Gene Type
|
protein coding |
|
HPA Location Info
|
Cytosol; 
|
|
HPA Protein Class Info
|
Cancer-related genes, Disease related genes, FDA approved drug targets, Nuclear receptors, Plasma proteins, Predicted intracellular proteins, Transcription factors |
|
Gene Function
|
Oncogene
|
|
Uniport_ID
|
P10275
|
|
HGNC ID
|
HGNC:644
|
|
VEGA ID
|
OTTHUMG00000021740
|
|
OMIM ID
|
313700 |
|
String ID
|
9606.ENSP00000363822
|
|
Drugbank ID
|
BE0000132
|
|
PharmGKB ID
|
PA57
|
Target gene [AR] related to VISs 
Relationship between gene expression and immune infiltrating cell level
| Data ID |
Disease |
Sample number |
Sample type |
|
GSE55851 (GEO) |
Adult T-cell leukemia |
21 |
Normal (3), Asymptomatic carriers (HTLV1+)(6), Adult T-cell Leukemia-lymphoma (HTLV1+)(12) |
|
GSE29312 (GEO) |
HTLV-1 associated myelopathy |
39 |
Normal (9), Asymptomatic carriers (HTLV1+)(20), HTLV-1-associated myelopathy (HTLV1+)(10) |
|
GSE29332 (GEO) |
HTLV-1 associated myelopathy |
35 |
Normal (8), Asymptomatic carriers (HTLV1+)(17), HTLV-1-associated myelopathy (HTLV1+)(10) |
> Dataset: GSE55851
|
|
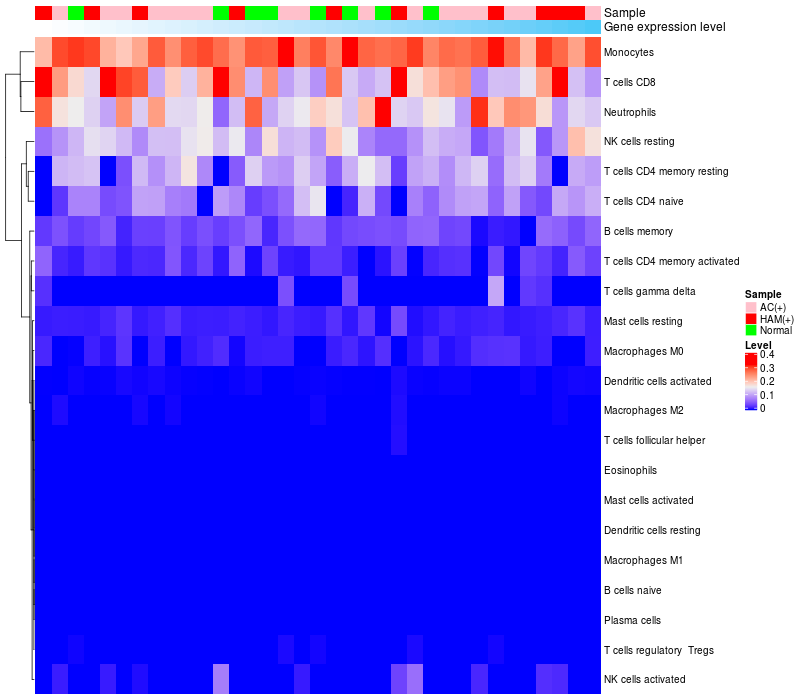
HeatMap of cell type fractions in all samples
|
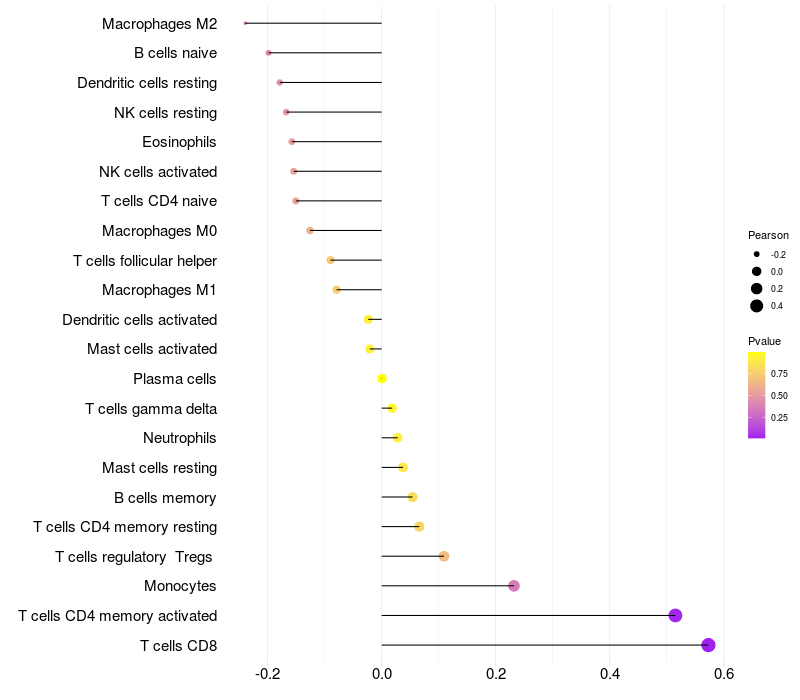
Lollipop of AR expression and immune infiltrating cell level correlation result in HTLV1+ samples
|
AR expression: Low -> High

|
|
|
> Dataset: GSE29312
|
|
HeatMap of cell type fractions in all samples
|
Lollipop of AR expression and immune infiltrating cell level correlation result in HTLV1+ samples
|
AR expression: Low -> High

|

|
|
> Dataset: GSE29332
|
|
HeatMap of cell type fractions in all samples
|
Lollipop of AR expression and immune infiltrating cell level correlation result in HTLV1+ samples
|
AR expression: Low -> High
|

|
|
|
|

 HTLV1 Target gene Detail Information